IBM 2009 Annual Report Download - page 39
Download and view the complete annual report
Please find page 39 of the 2009 IBM annual report below. You can navigate through the pages in the report by either clicking on the pages listed below, or by using the keyword search tool below to find specific information within the annual report.-
 1
1 -
2
-
3
-
4
-
5
-
6
-
7
-
8
-
9
-
10
-
11
-
12
-
13
-
14
-
15
-
16
-
17
-
18
-
19
-
20
-
21
-
22
-
23
-
24
-
25
-
26
-
27
-
28
-
 29
29 -
 30
30 -
 31
31 -
 32
32 -
 33
33 -
 34
34 -
 35
35 -
 36
36 -
 37
37 -
 38
38 -
 39
39 -
 40
40 -
 41
41 -
 42
42 -
 43
43 -
 44
44 -
 45
45 -
 46
46 -
 47
47 -
 48
48 -
 49
49 -
50
-
51
-
52
-
53
-
54
-
55
-
56
-
57
-
58
-
59
-
60
-
61
-
62
-
63
-
64
-
65
-
66
-
67
-
68
-
69
-
70
-
71
-
72
-
73
-
74
-
75
-
76
-
77
-
78
-
79
-
80
-
81
-
82
-
83
-
84
-
85
-
86
-
87
-
88
-
89
-
90
-
91
-
92
-
93
-
94
-
95
-
96
-
97
-
98
-
99
-
100
-
101
-
102
-
103
-
104
-
105
-
106
-
107
-
108
-
109
-
110
-
111
-
112
-
113
-
114
-
115
-
116
-
117
-
118
-
119
-
120
-
121
-
122
-
123
-
124
-
125
-
126
-
127
-
128
-
129
-
130
-
131
-
132
-
133
-
134
-
135
-
136
 |
 |

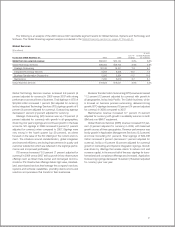
• An increase in deferred income of $392 million including a
currency impact of $117 million;
• An increase in executive compensation plan accruals of $300
million primarily due to improvement in market returns; and
• An increase of $200 million in deferred tax liabilities.
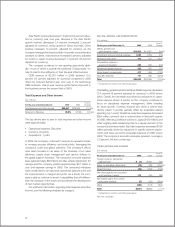
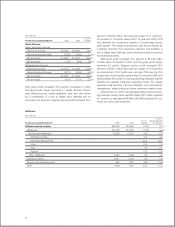
Debt
The company’s funding requirements are continually monitored
and strategies are executed to manage the overall asset and
liability profile.
($ in millions)
At December 31: 2009 2008
Total company debt $26,099 $33,926
Total Global Financing segment debt: $22,383 $24,360
Debt to support external clients 19,091 20,892
Debt to support internal clients 3,292 3,468
The Global Financing business provides funding predominantly
for the company’s external client assets as well as for certain
assets under contract by other IBM units. These assets, pri-
marily for Global Services, generate long-term, stable revenue
streams similar to the Global Financing asset portfolio. Based
on their nature, these Global Services assets are leveraged con-
sistent with the balance of the Global Financing asset base. The
debt analysis above is further detailed in the Global Finan cing
section on page 60.
Total debt decreased $7,826 million in 2009 versus 2008,
primarily as a result of the repayment of debt issued in support
of the 2007 accelerated share repurchase program.
Given the significant leverage, the company presents a debt-
to-capitalization ratio which excludes Global Financing debt and
equity as management believes this is more representative of the
company’s core business operations. This ratio can vary from
period to period as the company manages its global cash and
debt positions.
“Core” debt-to-capitalization ratio (excluding Global Financing
debt and equity) was 16.0 percent at December 31, 2009 com-
pared to 48.7 percent at December 31, 2008. The reduction
was primarily driven by the decrease in non-Global Financing
debt of $5,849 million and growth in non-Global Financing
equity of $9,493 million from December 31, 2008 balances.
Consolidated debt-to-capitalization ratio at December 31, 2009
was 53.4 percent versus 71.4 percent at December 31, 2008.
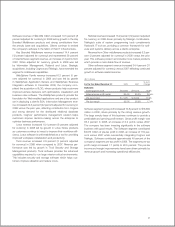
Equity
($ in millions)
At December 31: 2009 2008*
Equity
Total $22,755 $13,584
* Reflects the adoption of the FASB guidance on noncontrolling interests in con-
solidated financial statements. See note B, “Accounting Changes,” on pages 79
to 82 for additional information.
Total equity increased $9,170 million in 2009 as a result of several
key factors:
• An increase of $10,546 million in retained earnings primarily
driven by net income of $13,425 million, partially offset by
dividends ($2,860 million); and
• An increase of $3,015 million as a result of lower accumu-
lated other comprehensive income/(loss), primarily from a
positive impact from foreign currency translation adjustments
of $1,732 million, in addition to pension remeasurements and
other retirement-related activities of $1,727 million; partially
offset by deferred losses from hedging programs in the cur-
rent year of $481 million in comparison to deferred gains of
$74 million in 2008; partially offset by:
• A decrease related to net stock transactions of $4,390 million,
driven by less common stock repurchases in 2009 versus 2008.
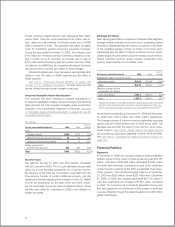
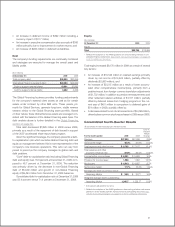
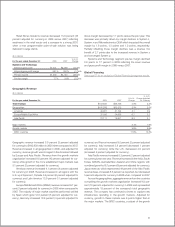
Consolidated Fourth-Quarter Results
($ and shares in millions except per share amounts)
Yr.-to-Yr.
Percent/
Margin
For the fourth quarter: 2009 2008 Change
Revenue $27,230 $27,006 0.8%*
Gross profit margin 48.3% 47.9% 0.4 pts.
Total expense and other income $ 6,765 $ 7,127 (5.1)%
Total expense and other
income-to-revenue ratio 24.8% 26.4% (1.5) pts.
Income before income taxes $ 6,381 $ 5,808 9.9%
Provision for income taxes 1,568 1,382 13.5%
Net income $ 4,813 $ 4,427 8.7%
Net income margin 17.7% 16.4% 1.3 pts.
Earnings per share of common stock:
Assuming dilution $ 3.59 $ 3.27+ 9.8%
Weighted-average shares outstanding:
Assuming dilution 1,340.7 1,353.7+ (1.0)%
* (5.5) percent adjusted for currency.
+ Reflects the adoption of the FASB guidance in determining whether instruments
granted in share-based payment transactions are participating securities. See
note B, “Accounting Changes,” on pages 79 to 82 for additional information.
37