IBM 2009 Annual Report Download - page 41
Download and view the complete annual report
Please find page 41 of the 2009 IBM annual report below. You can navigate through the pages in the report by either clicking on the pages listed below, or by using the keyword search tool below to find specific information within the annual report.-
 1
1 -
2
-
3
-
4
-
5
-
6
-
7
-
8
-
9
-
10
-
11
-
12
-
13
-
14
-
15
-
16
-
17
-
18
-
19
-
20
-
21
-
22
-
23
-
24
-
25
-
26
-
27
-
28
-
29
-
30
-
 31
31 -
 32
32 -
 33
33 -
 34
34 -
 35
35 -
 36
36 -
 37
37 -
 38
38 -
 39
39 -
 40
40 -
 41
41 -
 42
42 -
 43
43 -
 44
44 -
 45
45 -
 46
46 -
 47
47 -
 48
48 -
 49
49 -
 50
50 -
 51
51 -
52
-
53
-
54
-
55
-
56
-
57
-
58
-
59
-
60
-
61
-
62
-
63
-
64
-
65
-
66
-
67
-
68
-
69
-
70
-
71
-
72
-
73
-
74
-
75
-
76
-
77
-
78
-
79
-
80
-
81
-
82
-
83
-
84
-
85
-
86
-
87
-
88
-
89
-
90
-
91
-
92
-
93
-
94
-
95
-
96
-
97
-
98
-
99
-
100
-
101
-
102
-
103
-
104
-
105
-
106
-
107
-
108
-
109
-
110
-
111
-
112
-
113
-
114
-
115
-
116
-
117
-
118
-
119
-
120
-
121
-
122
-
123
-
124
-
125
-
126
-
127
-
128
-
129
-
130
-
131
-
132
-
133
-
134
-
135
-
136
 |
 |

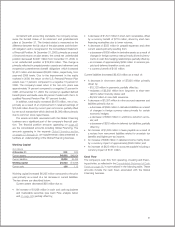
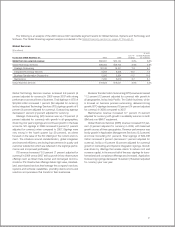
Software gross profit increased 2.4 percent with a flat mar-
gin year to year. The Software segment delivered pre-tax profit
of $3,058 million, an increase of 9.6 percent. The pre-tax margin
of 41.5 percent increased 2.4 points compared to fourth-quar-
ter 2008.
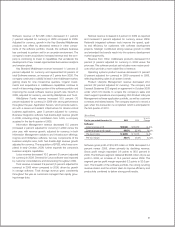
Systems and Technology revenue of $5,190 million decreased
4.3 percent (9 percent adjusted for currency). The rate of year-
to-year decline improved sequentially for the second consecutive
quarter. System z revenue decreased 26.8 percent (31 percent
adjusted for currency). System z MIPS shipments decreased
19 percent year to year. Volume performance was consistent
with expectations for this point in the product cycle. Converged
System p revenue declined 13.8 percent (18 percent adjusted
for currency). Although revenue has declined, the brand has
continued to gain market share, up 4 points in the quarter. In
the fourth quarter, sales generated by UNIX competitive dis-
placements was approximately $200 million. System x revenue
increased 36.8 percent (30 percent adjusted for currency),
with share gains in server (3 points) and blades (6 points). The
improved sales model and enhanced product offerings were the
key contributors to the fourth quarter performance. Systems
Storage revenue increased 1.4 percent (decreased 4 percent
adjusted for currency). Total disk revenue increased 6.1 percent
(1 percent adjusted for currency) driven by strong growth in
midrange and XIV. Tape revenue declined 9.8 percent (15 per-
cent adjusted for currency) versus the fourth quarter of 2008.
Microelectronics OEM revenue increased 1.9 percent in the
fourth quarter. The company’s 300 millimeter fabrication facility is
nearing full utilization and the 45 nanometer process output was
sold out again this quarter.
Systems and Technology gross margin of 42.5 percent,
increased 2.6 points versus the fourth quarter of 2008 with
margin improvement in all brands. This was the highest gross
profit margin since the fourth quarter of 2007 and was driven by
improvements in System x server and converged System p. The
Systems and Technology segment pre-tax profit increased 15.3
percent to $832 million. Pre-tax margin increased 2.6 points to
15.4 percent compared to the fourth quarter of 2008.
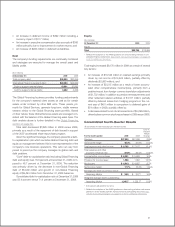
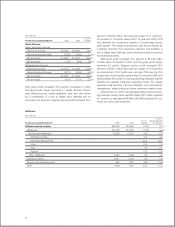
Global Financing external revenue of $621 million decreased
5.9 percent (12 percent adjusted for currency), driven by decreased
financing revenue. The Global Financing segment delivered 2.0
points of external gross margin improvement and 5.5 points of
total pre-tax margin expansion in the fourth quarter of 2009.
Geographic revenue increased 0.7 percent (decreased 6
percent adjusted for currency) with declines in all geographies,
adjusted for currency. Revenue in the major markets decreased
2.2 percent (7 percent adjusted for currency) and was 1 point
weaker than third quarter performance, adjusted for currency.
The U.K. had solid growth and revenue performance improved
sequentially in Canada and Japan (adjusted for currency).
Revenue in the growth markets increased 14.3 percent (2
percent adjusted for currency), 9 points higher than the major
markets, adjusted for currency. The growth markets contributed
20 percent of the geographic revenue in the fourth quarter. The
BRIC countries were up 18.4 percent (7 percent adjusted for
currency) driven by India, Brazil and China. Americas revenue
was $11,106 million, a decrease of 3.0 percent (6 percent
adjusted for currency). Adjusted for currency, revenue increased
2 percent in Latin America, while the U.S. declined 8 percent
and Canada declined 1 percent. EMEA revenue increased 2.4
percent (decreased 7 percent adjusted for currency) to $9,694
million. In the major market countries, when adjusted for cur-
rency, revenue in Germany declined 8 percent, France declined
12 percent, Italy declined 11 percent and Spain declined 11
percent while the U.K. was up 4 percent. Asia Pacific revenue
increased 5.7 percent (decreased 3 percent adjusted for cur-
rency) to $5,782 million, with the growth markets up 14.3
percent (3 percent adjusted for currency) and Japan down 2.8
percent (9 percent adjusted for currency).
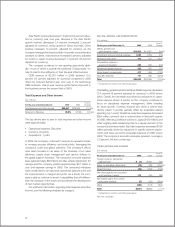
Total expense and other income decreased 5.1 percent
compared to the fourth quarter of 2008 and the expense-to-
revenue-ratio improved 1.5 points. The decrease was driven by
lower operational expenses (approximately 15 points), partially
offset by 9 points due to the impact of currency and 1 point due
to the impact of acquisitions. The company continues to execute
its operational plan to increase efficiency and drive productiv-
ity by leveraging its scale and global presence. Initiatives such
as globalization of support functions and services delivery and
workforce balancing have yielded significant expense and cost
savings. Within selling, general and administrative expense,
workforce reduction charges decreased approximately $340 mil-
lion in the fourth quarter.
The company’s effective tax rate in the fourth-quarter 2009
was 24.6 percent compared with 23.8 percent in the fourth
quarter of 2008. The higher rate was primarily driven by higher
utilization of tax credits in the prior year.
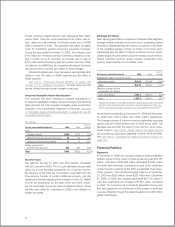
Share repurchases totaled $3,128 million in the fourth quar-
ter. The weighted-average number of diluted common shares
outstanding in the fourth quarter of 2009 was 1,340.7 million
compared with 1,353.7 million in the fourth quarter of 2008.
The company ended the quarter with $12,183 million of cash
and cash equivalents and generated $6,448 million in cash flow
provided by operating activities driven primarily by net income.
Net cash from investing activities was a use of cash of $2,495
million in fourth quarter of 2009 and Net cash from financing
activities was a use of cash of $1,206 million.
39