IBM 2009 Annual Report Download - page 34
Download and view the complete annual report
Please find page 34 of the 2009 IBM annual report below. You can navigate through the pages in the report by either clicking on the pages listed below, or by using the keyword search tool below to find specific information within the annual report.-
 1
1 -
2
-
3
-
4
-
5
-
6
-
7
-
8
-
9
-
10
-
11
-
12
-
13
-
14
-
15
-
16
-
17
-
18
-
19
-
20
-
21
-
22
-
23
-
 24
24 -
 25
25 -
 26
26 -
 27
27 -
 28
28 -
 29
29 -
 30
30 -
 31
31 -
 32
32 -
 33
33 -
 34
34 -
 35
35 -
 36
36 -
 37
37 -
 38
38 -
 39
39 -
 40
40 -
 41
41 -
 42
42 -
 43
43 -
 44
44 -
45
-
46
-
47
-
48
-
49
-
50
-
51
-
52
-
53
-
54
-
55
-
56
-
57
-
58
-
59
-
60
-
61
-
62
-
63
-
64
-
65
-
66
-
67
-
68
-
69
-
70
-
71
-
72
-
73
-
74
-
75
-
76
-
77
-
78
-
79
-
80
-
81
-
82
-
83
-
84
-
85
-
86
-
87
-
88
-
89
-
90
-
91
-
92
-
93
-
94
-
95
-
96
-
97
-
98
-
99
-
100
-
101
-
102
-
103
-
104
-
105
-
106
-
107
-
108
-
109
-
110
-
111
-
112
-
113
-
114
-
115
-
116
-
117
-
118
-
119
-
120
-
121
-
122
-
123
-
124
-
125
-
126
-
127
-
128
-
129
-
130
-
131
-
132
-
133
-
134
-
135
-
136
 |
 |

Asia Pacific revenue decreased 1.9 percent (4 percent adjus-
ted for currency) year over year. Revenue in the Asia Pacific
growth markets decreased 2.4 percent (increased 3 percent
adjusted for currency), led by growth in China and India. China
revenue increased 10 percent, adjusted for currency, as the
company leveraged its broad portfolio to provide comprehensive
solutions to clients. India revenue increased 6 percent, adjusted
for currency. Japan revenue decreased 1.4 percent (10 percent
adjusted for currency).
The company continues to see growing opportunity glob-
ally—much of which is outside the traditional IT opportunity—to
help its clients drive efficiency in their physical infrastructures.
OEM revenue of $2,281 million in 2009 declined 15.2
percent (15 percent adjusted for currency) compared to 2008
driven by reduced demand year over year in the technology
OEM business. Year-to-year revenue performance improved in
this business across the second half of 2009.
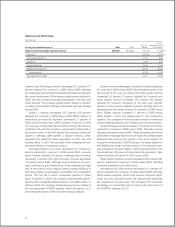
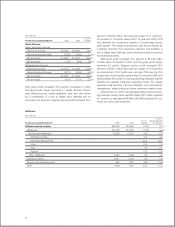
Total Expense and Other Income
($ in millions)
Yr.-to-Yr.
For the year ended December 31: 2009 2008 Change
Total expense and other income $25,647 $28,945 (11.4)%
Expense to Revenue 26.8% 27.9% (1.1) pts.
The key drivers year to year in total expense and other income
were approximately:
• Operational expense, (9) points
• Currency, (4) points
• Acquisitions, 1 point
In 2009, the company continued to execute its operational plan
to increase process efficiency and productivity; leveraging the
company’s scale and global presence. The company’s efforts
have been focused on all areas of the business—from sales
efficiency, supply chain management and service delivery to
the global support functions. The company’s cost and expense
base (approximately $80 billion) provides ample opportunity for
savings and the company yielded approximately $3.7 billion in
cost and expense savings in 2009. The company’s initiatives
have contributed to an improved operational balance point and
the improvements in margins and profit. As a result, the com-
pany is able to continue to invest in capabilities that will differen-
tiate the company in the future and accelerate the development
of new market opportunities.
For additional information regarding total expense and other
income, see the following analyses by category.
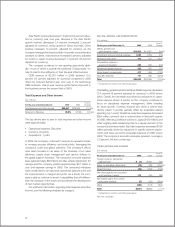
SELLING, GENERAL AND ADMINISTRATIVE
($ in millions)
Yr.-to-Yr.
For the year ended December 31: 2009 2008* Change
Selling, general and
administrative — base $18,056 $19,967 (9.6)%
Advertising and promotional expense 1,252 1,259 (0.6)
Workforce reductions 474 737 (35.7)
Amortization expense —
acquired intangibles 285 306 (6.9)
Retirement-related expense 322 326 (1.2)
Stock-based compensation 417 484 (13.9)
Bad debt expense 147 306 (52.0)
Total $20,952 $23,386 (10.4)%
* Reclassified to conform with 2009 presentation.
Total Selling, general and administrative (SG&A) expense decreased
10.4 percent (8 percent adjusted for currency) in 2009 versus
2008. Overall, the decrease was driven by reductions in opera-
tional expense (down 9 points) as the company continues to
focus on disciplined expense management, while investing
for future growth. Currency impacts also drove a year-to-year
decline (down 3 points), partially offset by acquisition-related
spending (up 1 point). Workforce reductions expense decreased
$264 million, primarily due to actions taken in the fourth quarter
of 2008, reflecting workforce actions in Japan ($120 million) and
other ongoing skills rebalancing that is a regular element of the
company’s business model. Bad debt expense decreased $159
million primarily driven by reductions in specific reserve require-
ments and lower accounts receivable balances in 2009 versus
2008. The company’s accounts receivable provision coverage is
2.0 percent, flat from a year ago.
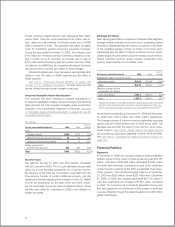
OTHER (INCOME) AND EXPENSE
($ in millions)
Yr.-to-Yr.
For the year ended December 31: 2009 2008* Change
Foreign currency transaction
(gains)/losses $ (1) $ 328 NM
Gains on derivative instruments (12) (26) (53.4)%
Interest income (94) (343) (72.6)
Net losses/(gains) from securities
and investment assets 112 (52) NM
Net realized gains from certain
real estate activities (5) (26) (82.6)
Other (352) (179) 96.8
Total $(351) $(298) 17.7%
* Reclassified to conform with 2009 presentation.
NM—Not meaningful
32