IBM 2009 Annual Report Download - page 35
Download and view the complete annual report
Please find page 35 of the 2009 IBM annual report below. You can navigate through the pages in the report by either clicking on the pages listed below, or by using the keyword search tool below to find specific information within the annual report.
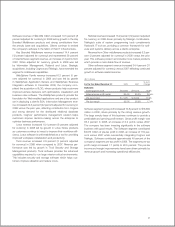
Other (income) and expense was income of $351 million in
2009, an increase in income of $53 million year to year. The
increase was driven by several key factors: the $298 million gain,
reflected in Other, from the core logistics operations divestiture;
increased foreign currency transaction gains of $329 million;
offset by less interest income of $249 million due to lower rates;
less gains from securities transactions of $162 million due to
Lenovo equity sales in 2008; and a 2009 loss provision related to
a joint venture investment of $119 million, also reflected in Other.
RESEARCH, DEVELOPMENT AND ENGINEERING
($ in millions)
Yr.-to-Yr.
For the year ended December 31: 2009 2008 Change
Research, development
and engineering
Total $5,820 $6,337 (8.2)%
The company continues to invest in research and development,
focusing its investments on high-value, high-growth opportunities.
Total Research, development and engineering (RD&E) expense
decreased 8.2 percent in 2009 versus 2008; adjusted for cur-
rency, expense decreased 6 percent in 2009. The decrease in
spending, adjusted for currency, was driven by continued process
efficiencies and reductions in discretionary spending, partially off-
set by the impact of acquisitions. RD&E investments represented
6.1 percent of total revenue in 2009, flat compared to 2008.
INTELLECTUAL PROPERTY AND CUSTOM DEVELOPMENT INCOME
($ in millions)
Yr.-to-Yr.
For the year ended December 31: 2009 2008 Change
Sales and other transfers
of intellectual property $ 228 $ 138 65.5%
Licensing/royalty-based fees 370 514 (28.0)
Custom development income 579 501 15.5
Total $1,177 $1,153 2.1%
The timing and amount of sales and other transfers of IP may
vary significantly from period to period depending upon timing
of divestitures, industry consolidation, economic conditions and
the timing of new patents and know-how development. There
were no significant individual IP transactions in 2009 or 2008.
INTEREST EXPENSE
($ in millions)
Yr.-to-Yr.
For the year ended December 31: 2009 2008 Change
Interest expense
Total $402 $673 (40.3)%
The decrease in interest expense was primarily due to lower debt
balances in 2009 versus 2008. Total debt at December 31, 2009
was $26.1 billion; a decline of $7.8 billion of primarily non-Global
Financing debt. Interest expense is presented in cost of financ-
ing in the Consolidated State ment of Earnings if the related
external borrowings are to support the Global Financing external
business. Overall interest expense for 2009 was $1,109 million,
a decrease of $353 million versus 2008.
Stock-Based Compensation
Total pre-tax stock-based compensation cost of $558 million
decreased $101 million compared to 2008. The decrease was
principally the result of a reduction in the level of stock option
grants ($159 million), offset by an increase related to restricted
and performance-based share units ($58 million). The year-to-
year change was reflected in the following categories: reductions
in cost ($22 million), RD&E expense ($12 million), and SG&A
expense ($67 million).
See note T, “Stock-Based Compensation,” on pages 105 to
109 for additional information on stock-based incentive awards.
Retirement-Related Benefits
The following table presents the total pre-tax cost for all retirement-
related plans. These amounts are included in the Consolidated
Statement of Earnings within the category (e.g., cost, SG&A,
RD&E) relating to the job function of the plan participants.
($ in millions)
Yr.-to-Yr.
For the year ended December 31: 2009 2008* Change
Defined benefit and contribution
pension plans cost $1,065 $1,076 (1.1)%
Nonpension postretirement plans costs 350 363 (3.6)
Total $1,415 $1,439 (1.7)%
* Reclassified to conform with 2009 presentation.
33


