IBM 2009 Annual Report Download - page 129
Download and view the complete annual report
Please find page 129 of the 2009 IBM annual report below. You can navigate through the pages in the report by either clicking on the pages listed below, or by using the keyword search tool below to find specific information within the annual report.-
 1
1 -
2
-
3
-
4
-
5
-
6
-
7
-
8
-
9
-
10
-
11
-
12
-
13
-
14
-
15
-
16
-
17
-
18
-
19
-
20
-
21
-
22
-
23
-
24
-
25
-
26
-
27
-
28
-
29
-
30
-
31
-
32
-
33
-
34
-
35
-
36
-
37
-
38
-
39
-
40
-
41
-
42
-
43
-
44
-
45
-
46
-
47
-
48
-
49
-
50
-
51
-
52
-
53
-
54
-
55
-
56
-
57
-
58
-
59
-
60
-
61
-
62
-
63
-
64
-
65
-
66
-
67
-
68
-
69
-
70
-
71
-
72
-
73
-
74
-
75
-
76
-
77
-
78
-
79
-
80
-
81
-
82
-
83
-
84
-
85
-
86
-
87
-
88
-
89
-
90
-
91
-
92
-
93
-
94
-
95
-
96
-
97
-
98
-
99
-
100
-
101
-
102
-
103
-
104
-
105
-
106
-
107
-
108
-
109
-
110
-
111
-
112
-
113
-
114
-
115
-
116
-
117
-
118
-
 119
119 -
 120
120 -
 121
121 -
 122
122 -
 123
123 -
 124
124 -
 125
125 -
 126
126 -
 127
127 -
 128
128 -
 129
129 -
 130
130 -
 131
131 -
 132
132 -
 133
133 -
 134
134 -
 135
135 -
 136
136
 |
 |

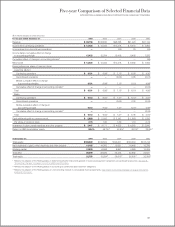
Five-year Comparison of Selected Financial Data
INTERNATIONAL BUSINESS MACHINES CORPORATION AND SUBSIDIARY COMPANIES
($ in millions except per share amounts)
For the year ended December 31: 2009 2008 2007 2006 2005
Revenue $ 95,758 $103,630 $98,786 $91,424 $91,134
Income from continuing operations $ 13,425 $ 12,334 $10,418 $ 9,416 $ 7,994
Income/(loss) from discontinued operations — — (00) 76 (24)
Income before cumulative effect of change
in accounting principle 13,425 12,334 10,418 9,492 7,970
Cumulative effect of change in accounting principle** — — — — (36)
Net income $ 13,425 $ 12,334 $10,418 $ 9,492 $ 7,934
Earnings/(loss) per share of common stock:
Assuming dilution:
Continuing operations $ 10.01 $ 8.89* $ 7.15* $ 6.05* $ 4.90*
Discontinued operations — — (0.00) 0.05 (0.01)
Before cumulative effect of change
in accounting principle 10.01 8.89* 7.15* 6.10* 4.89*
Cumulative effect of change in accounting principle** — — — — (0.02)
Total $ 10.01 $ 8.89* $ 7.15* $ 6.10* $ 4.86*
Basic:
Continuing operations $ 10.12 $ 9.02* $ 7.27* $ 6.13* $ 4.97*
Discontinued operations — — (0.00) 0.05 (0.02)
Before cumulative effect of change in
accounting principle 10.12 9.02* 7.27* 6.18* 4.96*
Cumulative effect of change in accounting principle** — — — — (0.02)
Total $ 10.12 $ 9.02* $ 7.27* $ 6.18* $ 4.94*
Cash dividends paid on common stock $ 2,860 $ 2,585 $ 2,147 $ 1,683 $ 1,250
Per share of common stock 2.15 1.90 1.50 1.10 0.78
Investment in plant, rental machines and other property $ 3,447 $ 4,171 $ 4,630 $ 4,362 $ 3,842
Return on IBM stockholders’ equity 80.4% 48.7%+ 42.6%+ 29.3%+ 25.8%+
At December 31: 2009 2008 2007 2006 2005
Total assets $109,022 $109,524 $120,431 $103,234 $105,748
Net investment in plant, rental machines and other property 14,165 14,305 15,081 14,440 13,756
Working capital 12,933 6,568 8,867 4,569 10,509
Total debt 26,099 33,926 35,274 22,682 22,641
Total equity 22,755 13,584+ 28,615+ 28,635+ 33,209+
* Reflects the adoption of the FASB guidance in determining whether instruments granted in share-based payment transactions are participating securities. See note B,
“Accounting Changes,” on pages 79 to 82 for additional information.
** Reflects the adoption of the FASB guidance in accounting for conditional asset retirement obligations.
+ Reflects the adoption of the FASB guidance on noncontrolling interests in consolidated financial statements. See note B, “Accounting Changes,” on pages 79 to 82 for
additional information.
127