IBM 2009 Annual Report Download - page 40
Download and view the complete annual report
Please find page 40 of the 2009 IBM annual report below. You can navigate through the pages in the report by either clicking on the pages listed below, or by using the keyword search tool below to find specific information within the annual report.-
 1
1 -
2
-
3
-
4
-
5
-
6
-
7
-
8
-
9
-
10
-
11
-
12
-
13
-
14
-
15
-
16
-
17
-
18
-
19
-
20
-
21
-
22
-
23
-
24
-
25
-
26
-
27
-
28
-
29
-
 30
30 -
 31
31 -
 32
32 -
 33
33 -
 34
34 -
 35
35 -
 36
36 -
 37
37 -
 38
38 -
 39
39 -
 40
40 -
 41
41 -
 42
42 -
 43
43 -
 44
44 -
 45
45 -
 46
46 -
 47
47 -
 48
48 -
 49
49 -
 50
50 -
51
-
52
-
53
-
54
-
55
-
56
-
57
-
58
-
59
-
60
-
61
-
62
-
63
-
64
-
65
-
66
-
67
-
68
-
69
-
70
-
71
-
72
-
73
-
74
-
75
-
76
-
77
-
78
-
79
-
80
-
81
-
82
-
83
-
84
-
85
-
86
-
87
-
88
-
89
-
90
-
91
-
92
-
93
-
94
-
95
-
96
-
97
-
98
-
99
-
100
-
101
-
102
-
103
-
104
-
105
-
106
-
107
-
108
-
109
-
110
-
111
-
112
-
113
-
114
-
115
-
116
-
117
-
118
-
119
-
120
-
121
-
122
-
123
-
124
-
125
-
126
-
127
-
128
-
129
-
130
-
131
-
132
-
133
-
134
-
135
-
136
 |
 |

The fourth quarter capped off a great year for the company in
an uncertain economic environment with financial performance
driven by continued margin expansion, profit growth and cash
generation. Total revenue increased 0.8 percent as reported and
decreased 5.5 percent, adjusted for currency, versus the fourth
quarter of 2008. Systems and Technology year-to-year revenue
growth improved sequentially in the quarter with share gains in
System p, System x and Storage. Software had share gains in
WebSphere, Tivoli and Key Branded Middleware. Global Services
revenue, adjusted for currency, was consistent with third-quarter
performance while signings and backlog both increased year to
year. Gross profit margin expanded 40 basis points primarily due
to improved margins in services and systems as the company’s
productivity initiatives continued to yield improvements in gross
margin. The company has improved gross margin in 21 of the
last 22 quarters. Total expense and other income decreased 5.1
percent driven by operational expense management. Pre-tax
income increased 9.9 percent and pre-tax margin improved 1.9
points versus the fourth-quarter 2008. Pre-tax profit increased
and margins expanded in every segment. Net income increased
8.7 percent and diluted earnings per share of $3.59 increased
9.8 percent year to year.
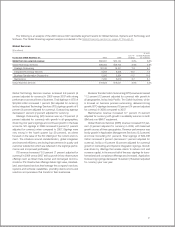
The Global Services segments combined had $14,630 mil-
lion of revenue in the fourth quarter, an increase of 2.1 percent
(decrease of 5 percent adjusted for currency) and delivered pre-
tax profit of $2,322 million, an increase of 6.7 percent year to
year. Total signings for Global Services in the fourth quarter were
$18,763 million, an increase of 9.0 percent (2 percent adjusted
for currency) versus 2008. Signings in the quarter included 22
deals larger than $100 million. Outsourcing signings of $11,385
million increased 15.0 percent (8 percent adjusted for currency).
Consulting and Systems Integration and Integrated Technology
Services signings increased 1.0 percent (decreased 6 percent
adjusted for currency) to $7,378 million.
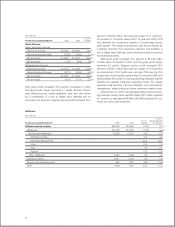
GTS revenue of $10,051 million increased 4.4 percent
(decreased 3 percent adjusted for currency) versus the fourth
quarter of 2008. GTS signings of $11,350 million increased
2.8 percent (decreased 4 percent adjusted for currency) with
outsourcing signings increasing 4.7 percent (decreased 1 per-
cent adjusted for currency), partially offset by a 2.9 percent
decrease (10 percent adjusted for currency) in Integrated Tech-
nology Services signings. SO revenue increased 5.6 percent
(decreased 2 percent adjusted for currency). SO signings
decreased 9.9 percent (16 percent adjusted for currency). ITS
revenue increased 0.2 percent (decreased 7 percent adjusted
for currency). Revenue performance largely reflects signings
performance which continued to be impacted by declines in
OEM as the portfolio shifts to higher value offerings. ITS signings
continued to be impacted by client deferrals and capital con-
straints. BTO revenue increased 7.0 percent (1 percent adjusted
for currency) and signings increased 132.9 percent (124 percent
adjusted for currency).
GTS gross profit margin improved 0.9 points to 35.8 percent
with margin expansion in all lines of business. The GTS segment
fourth-quarter pre-tax profit was up 8.3 percent and the pre-tax
margin improved 60 basis points to 15.0 percent from fourth-
quarter 2008.
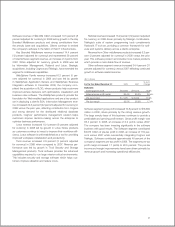
GBS revenue of $4,579 million decreased 2.8 percent (9
percent adjusted for currency) compared to the fourth-quarter
2008. GBS signings of $7,413 million, increased 20.3 percent (13
percent adjusted for currency), driven by a 65.4 percent increase
(55 percent adjusted for currency) in Application Outsourcing
signings. Consulting and Systems Integration signings increased
3.4 percent (decreased 3 percent adjusted for currency) in the
quarter, a significant improvement compared to third-quarter
2009. In the fourth quarter, small deal performance improved as
the quarter progressed, general business and distribution sec-
tors grew and the growth markets were up 34 percent, adjusted
for currency.
GBS gross profit increased 2.9 percent in the quarter with
the gross margin improving 1.7 points to 30.3 percent. The GBS
segment pre-tax profit increased 3.5 percent in the fourth quar-
ter and the pre-tax margin expanded 1.1 points to 16.0 percent,
a record margin performance for the segment. Pre-tax margin
was driven by strong utilization in the delivery centers, good sub-
contractor resource management and spending management.
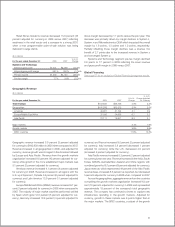
Software revenue of $6,577 million increased 2.4 percent
(decreased 4 percent adjusted for currency). Revenue perfor-
mance highlighted continued strength in demand in the growth
markets, strong contributions from recent acquisitions and an
increase in the volume of small deal activity in North America.
Key Branded Middleware increased 6.1 percent (flat adjusted for
currency) and represented 63 percent of total software revenue,
an increase of 2 points year to year. WebSphere Family revenue
increased 12.9 percent (6 percent adjusted for currency) in
the quarter. Business Process Management, Commerce and
DataPower products all had double-digit revenue growth. ILOG
performed well again this quarter and contributed to the overall
WebSphere growth. Information Management increased 7.1
percent (1 percent adjusted for currency). Business Analytics
continues to be a key growth area and Cognos posted
strong double-digit revenue growth in the quarter. InfoSphere
Warehouse, which helps customers turn information into a stra-
tegic asset, also grew double digits in the quarter. Tivoli software
revenue increased 7.2 percent (1 percent adjusted for currency).
Enterprise Asset Management, which is part of the Smarter
Planet strategy, grew over 40 percent in the growth markets,
adjusted for currency. Tivoli storage continued its strong growth
as customers manage their rapidly growing storage data. Data
Protection and Storage Management had double-digit rev-
enue growth, with broad-based geography and sector growth.
Rational revenue decreased 4.5 percent (10 percent adjusted for
currency) and Lotus revenue decreased 5.3 percent (11 percent
adjusted for currency).
38