IBM 2009 Annual Report Download - page 107
Download and view the complete annual report
Please find page 107 of the 2009 IBM annual report below. You can navigate through the pages in the report by either clicking on the pages listed below, or by using the keyword search tool below to find specific information within the annual report.-
 1
1 -
2
-
3
-
4
-
5
-
6
-
7
-
8
-
9
-
10
-
11
-
12
-
13
-
14
-
15
-
16
-
17
-
18
-
19
-
20
-
21
-
22
-
23
-
24
-
25
-
26
-
27
-
28
-
29
-
30
-
31
-
32
-
33
-
34
-
35
-
36
-
37
-
38
-
39
-
40
-
41
-
42
-
43
-
44
-
45
-
46
-
47
-
48
-
49
-
50
-
51
-
52
-
53
-
54
-
55
-
56
-
57
-
58
-
59
-
60
-
61
-
62
-
63
-
64
-
65
-
66
-
67
-
68
-
69
-
70
-
71
-
72
-
73
-
74
-
75
-
76
-
77
-
78
-
79
-
80
-
81
-
82
-
83
-
84
-
85
-
86
-
87
-
88
-
89
-
90
-
91
-
92
-
93
-
94
-
95
-
96
-
 97
97 -
 98
98 -
 99
99 -
 100
100 -
 101
101 -
 102
102 -
 103
103 -
 104
104 -
 105
105 -
 106
106 -
 107
107 -
 108
108 -
 109
109 -
 110
110 -
 111
111 -
 112
112 -
 113
113 -
 114
114 -
 115
115 -
 116
116 -
 117
117 -
118
-
119
-
120
-
121
-
122
-
123
-
124
-
125
-
126
-
127
-
128
-
129
-
130
-
131
-
132
-
133
-
134
-
135
-
136
 |
 |

Notes to Consolidated Financial Statements
INTERNATIONAL BUSINESS MACHINES CORPORATION AND SUBSIDIARY COMPANIES
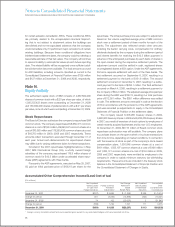
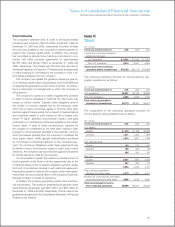
Note T.
Stock-Based Compensation
Stock-based compensation cost is measured at grant date,
based on the fair value of the award, and is recognized over
the employee requisite service period. See note A, “Significant
Accounting Policies,” on page 76 for additional information.
The following table presents total stock-based compensa-
tion cost included in the Consolidated Statement of Earnings.
($ in millions)
For the year ended December 31: 2009 2008 2007
Cost $ 94 $ 116 $ 166
Selling, general and administrative 417 484 480
Research, development and engineering 47 58 68
Other (income) and expense* — — (1)
Pre-tax stock-based compensation cost 558 659 713
Income tax benefits (221) (224) (248)
Total stock-based
compensation cost $ 337 $ 435 $ 464
* Reflects the one-time effects of the divestiture of the Printing Systems business
in the second quarter of 2007.
Total unrecognized compensation cost related to non-vested
awards at December 31, 2009 and 2008 was $1,082 million and
$1,076 million, respectively, and is expected to be recognized
over a weighted-average period of approximately 2.5 years.
There was no significant capitalized stock-based compensa-
tion cost at December 31, 2009, 2008 and 2007.
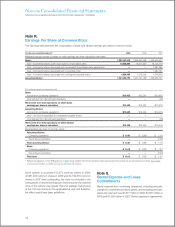
Incentive Awards
Stock-based incentive awards are provided to employees under
the terms of the company’s long-term performance plans (the
“Plans”). The Plans are administered by the Executive Compen-
sation and Management Resources Com mittee of the Board of
Directors (the “Committee”). Awards available under the Plans
principally include stock options, restricted stock units, perfor-
mance share units or any combination thereof. The nonmanage-
ment members of the IBM Board of Directors also received stock
options under a director stock option plan through December 31,
2006. The director stock option plan was terminated effective
January 1, 2007.
The amount of shares originally authorized to be issued under
the company’s existing Plans was 274.1 million at December 31,
2009 and 2008. In addition, certain incentive awards granted
under previous Plans, if and when those awards were canceled,
could be reissued under the company’s existing Plans. As such,
66.4 million and 47.6 million additional awards were considered
authorized to be issued under the company’s existing Plans as
of December 31, 2009 and 2008, respectively. There were 1.9
million and 23.8 million option awards outstanding (which were
included in the total options outstanding at December 31, 2009
and 2008, respectively) under previous Plans that, if and when
canceled, would increase the number of authorized shares.
There were 140.4 million and 130.1 million unused shares avail-
able to be granted under the Plans as of December 31, 2009
and 2008, respectively.
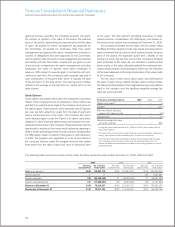
Under the company’s long-standing practices and policies,
all awards are approved prior to or on the date of grant. The
exercise price of at-the-money stock options is the average of
the high and low market price on the date of grant. The options
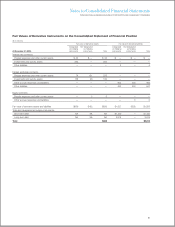
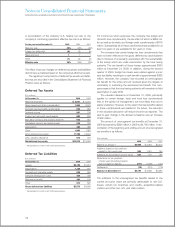
($ in millions)
2010 2011 2012 2013 2014 Beyond 2014
Operating lease commitments:
Gross minimum rental commitments
(including vacant space below) $1,504 $1,281 $982 $769 $626 $776
Vacant space $ 69 $ 37 $ 18 $ 9 $ 8 $ 9
Sublease income commitments $ 52 $ 27 $ 15 $ 8 $ 4 $ 2
Capital lease commitments $ 64 $ 25 $ 32 $ 31 $ 13 $ —
with rent holidays and scheduled rent increases is recorded on
a straight-line basis over the lease term. Contingent rentals are
included in the determination of rental expense as accruable.
The table below depicts gross minimum rental commitments
from continuing operations under noncancelable leases, amounts
related to vacant space associated with infrastructure reductions
and restructuring actions taken through 1994, and in 1999, 2002
and 2005 (previously reserved), sublease income commitments
and capital lease commitments. These amounts reflect activities
primarily related to office space, as well as manufacturing facilities.
105