IBM 2009 Annual Report Download - page 38
Download and view the complete annual report
Please find page 38 of the 2009 IBM annual report below. You can navigate through the pages in the report by either clicking on the pages listed below, or by using the keyword search tool below to find specific information within the annual report.-
 1
1 -
2
-
3
-
4
-
5
-
6
-
7
-
8
-
9
-
10
-
11
-
12
-
13
-
14
-
15
-
16
-
17
-
18
-
19
-
20
-
21
-
22
-
23
-
24
-
25
-
26
-
27
-
 28
28 -
 29
29 -
 30
30 -
 31
31 -
 32
32 -
 33
33 -
 34
34 -
 35
35 -
 36
36 -
 37
37 -
 38
38 -
 39
39 -
 40
40 -
 41
41 -
 42
42 -
 43
43 -
 44
44 -
 45
45 -
 46
46 -
 47
47 -
 48
48 -
49
-
50
-
51
-
52
-
53
-
54
-
55
-
56
-
57
-
58
-
59
-
60
-
61
-
62
-
63
-
64
-
65
-
66
-
67
-
68
-
69
-
70
-
71
-
72
-
73
-
74
-
75
-
76
-
77
-
78
-
79
-
80
-
81
-
82
-
83
-
84
-
85
-
86
-
87
-
88
-
89
-
90
-
91
-
92
-
93
-
94
-
95
-
96
-
97
-
98
-
99
-
100
-
101
-
102
-
103
-
104
-
105
-
106
-
107
-
108
-
109
-
110
-
111
-
112
-
113
-
114
-
115
-
116
-
117
-
118
-
119
-
120
-
121
-
122
-
123
-
124
-
125
-
126
-
127
-
128
-
129
-
130
-
131
-
132
-
133
-
134
-
135
-
136
 |
 |

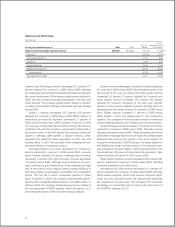
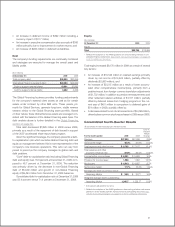
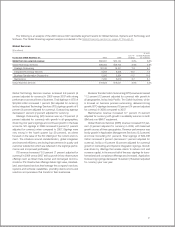
($ in millions)
For the year ended December 31: 2009 2008
Net cash provided by/(used in):
Operating activities $ 20,773 $ 18,812
Investing activities (6,729) (9,285)
Financing activities (14,700) (11,834)
Effect of exchange rate changes
on cash and cash equivalents 98 58
Net change in cash and cash equivalents $ (558) $ (2,250)
Net cash from operating activities for 2009 increased $1,961
million as compared to 2008 driven by the following key factors:
• An increase in cash provided by accounts receivable of
$1,857 million, driven by Global Financing receivables due to
lower volumes in 2009;
• Lower payments resulted in a benefit in accounts payable of
$1,030 million year to year;
• Tax refunds of approximately $710 million; partially offset by:
• Higher retirement-related funding of $875 million;
• Derivative instruments in cash flow hedging relationships rep-
resenting a use of cash of $247 million in the current year in
comparison to a source of cash of $176 million in 2008; and
• Higher payments for workforce rebalancing actions of $377
million.
Net cash used in investing activities decreased $2,556 million on
a year-to-year basis driven by:
• A decrease of $5,119 million in cash used for acquisitions
primarily driven by the acquisition of Cognos in 2008;
• A decrease in cash used in net capital spending of $704
million driven by a decline in rental additions and lower
invest ment requirements in the Strategic Outsourcing and
Microelectronics businesses; and
• An increase in cash from divestitures of $329 million as a
result of the Geodis transaction in 2009; partially offset by:
• The net impact of purchases and sales of marketable securi-
ties and other investments that resulted in a use of cash of
$2,005 million in the current year in comparison to a source
of cash in 2008 of $1,510 million.
Net cash used in financing activities increased $2,866 million
compared to 2008 as a result of:
• An increase of $5,019 million in net cash payments used to
retire debt;
• A decrease of $721 million in cash generated by other com-
mon stock transactions primarily due to lower stock option
exercises; partially offset by:
• Lower common stock repurchases of $3,150 million.
Within total debt, on a net basis, the company utilized $7,463
million in net cash to retire debt versus $2,444 million in net
cash used in 2008. The net cash used to retire debt in 2009
was comprised of: $13,495 million in cash payments to settle
debt and net payments of $651 million in short-term borrow-
ings, partially offset by $6,683 million of new debt issuances.
See note K, “Borrowings,” on pages 90 to 92 for a listing of the
company’s debt securities.
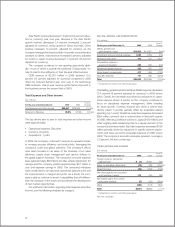
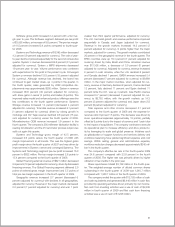
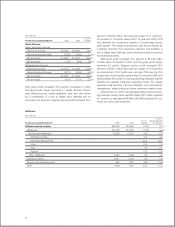
Noncurrent Assets and Liabilities
($ in millions)
At December 31: 2009 2008
Noncurrent assets $60,087 $60,520
Long-term debt $21,932 $22,689
Noncurrent liabilities (excluding debt) $28,334 $30,815*
* Reflects the adoption of the FASB guidance on noncontrolling interests in con-
solidated financial statements. See note B, “Accounting Changes,” on pages 79
to 82 for additional information.
The decrease in noncurrent assets of $433 million compared to
the prior year-end balance was primarily driven by:
• A decrease of $3,075 million in deferred taxes primarily driven
by pension related activity;
• A decrease of $904 million in long-term financing receiv-
ables, offset by a currency benefit of $365 million, driven by
maturities exceeding originations; and
• A decrease of $365 million in intangible assets driven by
amortization; partially offset by:
• An increase of $1,964 million in goodwill primarily driven by
a currency impact of $1,035 million and the acquisition of
SPSS; and
• An increase of $1,401 million in pension assets mainly driven
by plan contributions and pension remeasurements.
Long-term debt decreased $758 million primarily due to reclasses
to short-term debt as certain instruments approached maturity
($2,282 million); offset by new net debt issuances ($1,885 million).
Other noncurrent liabilities, excluding debt, decreased $2,481
million primarily driven by:
• A decrease of $3,500 million in retirement and nonpension
postretirement benefit obligations primarily driven by pension
remeasurements and plan contributions; partially offset by:
36