IBM 2009 Annual Report Download - page 127
Download and view the complete annual report
Please find page 127 of the 2009 IBM annual report below. You can navigate through the pages in the report by either clicking on the pages listed below, or by using the keyword search tool below to find specific information within the annual report.-
 1
1 -
2
-
3
-
4
-
5
-
6
-
7
-
8
-
9
-
10
-
11
-
12
-
13
-
14
-
15
-
16
-
17
-
18
-
19
-
20
-
21
-
22
-
23
-
24
-
25
-
26
-
27
-
28
-
29
-
30
-
31
-
32
-
33
-
34
-
35
-
36
-
37
-
38
-
39
-
40
-
41
-
42
-
43
-
44
-
45
-
46
-
47
-
48
-
49
-
50
-
51
-
52
-
53
-
54
-
55
-
56
-
57
-
58
-
59
-
60
-
61
-
62
-
63
-
64
-
65
-
66
-
67
-
68
-
69
-
70
-
71
-
72
-
73
-
74
-
75
-
76
-
77
-
78
-
79
-
80
-
81
-
82
-
83
-
84
-
85
-
86
-
87
-
88
-
89
-
90
-
91
-
92
-
93
-
94
-
95
-
96
-
97
-
98
-
99
-
100
-
101
-
102
-
103
-
104
-
105
-
106
-
107
-
108
-
109
-
110
-
111
-
112
-
113
-
114
-
115
-
116
-
 117
117 -
 118
118 -
 119
119 -
 120
120 -
 121
121 -
 122
122 -
 123
123 -
 124
124 -
 125
125 -
 126
126 -
 127
127 -
 128
128 -
 129
129 -
 130
130 -
 131
131 -
 132
132 -
 133
133 -
 134
134 -
 135
135 -
 136
136
 |
 |

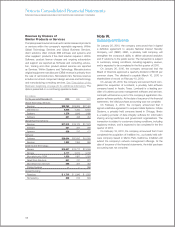
Notes to Consolidated Financial Statements
INTERNATIONAL BUSINESS MACHINES CORPORATION AND SUBSIDIARY COMPANIES
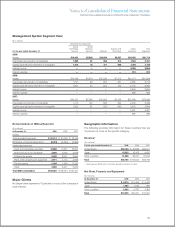
Management System Segment View
($ in millions)
Global Services Segments
Global Global
Technology Business Systems and Global Total
For the year ended December 31: Services Services Software Technology Financing Segments
2009:
Assets $16,422 $6,885 $16,894 $6,907 $34,605 $81,714
Depreciation/amortization of intangibles 1,680 87 906 814 1,694 5,181
Capital expenditures/investments in intangibles 1,512 45 471 658 1,460 4,145
Interest income — — — — 2,265 2,265
Interest expense — — — — 674 674
2008:
Assets $15,456 $6,874 $15,336 $7,313 $36,119 $81,098
Depreciation/amortization of intangibles 1,797 99 905 851 2,065 5,718
Capital expenditures/investments in intangibles 1,607 54 504 754 2,143 5,062
Interest income — — — — 2,604 2,604
Interest expense — — — — 988 988
2007:
Assets $16,157 $7,226 $10,042 $7,338 $37,586 $78,348
Depreciation/amortization of intangibles 1,714 122 684 894 2,034 5,448
Capital expenditures/investments in intangibles 1,803 61 559 840 2,432 5,694
Interest income — — — — 2,421 2,421
Interest expense — — — — 966 966
Reconciliations of IBM as Reported
($ in millions)
At December 31: 2009 2008 2007
Assets:
Total reportable segments $ 81,714 $ 81,098 $ 78,348
Elimination of internal transactions (5,481) (5,594) (5,964)
Unallocated amounts:
Cash and marketable securities 12,688 11,631 16,007
Notes and accounts receivable 3,928 3,632 3,639
Deferred tax assets 5,545 8,341 2,664
Plant, other property and equipment 2,971 3,172 3,098
Pension assets 2,994 1,594 17,397
Other 4,665 5,647 5,242
Total IBM consolidated $109,022 $109,524 $120,431
Major Clients
No single client represents 10 percent or more of the company’s
total revenue.
Geographic Information
The following provides information for those countries that are
10 percent or more of the specific category.
Revenue*
($ in millions)
For the year ended December 31: 2009 2008 2007
United States $34,150 $ 36,686 $36,511
Japan 10,222 10,403 9,632
Other countries 51,386 56,541 52,643
Total $95,758 $103,630 $98,786
* Revenues are attributed to countries based on location of client.
Net Plant, Property and Equipment
($ in millions)
At December 31: 2009 2008 2007
United States $ 6,313 $ 6,469 $ 6,592
Japan 1,050 1,055 890
Other countries 5,092 4,797 5,365
Total $12,455 $12,321 $12,847
125