IBM 2009 Annual Report Download - page 42
Download and view the complete annual report
Please find page 42 of the 2009 IBM annual report below. You can navigate through the pages in the report by either clicking on the pages listed below, or by using the keyword search tool below to find specific information within the annual report.-
 1
1 -
2
-
3
-
4
-
5
-
6
-
7
-
8
-
9
-
10
-
11
-
12
-
13
-
14
-
15
-
16
-
17
-
18
-
19
-
20
-
21
-
22
-
23
-
24
-
25
-
26
-
27
-
28
-
29
-
30
-
31
-
 32
32 -
 33
33 -
 34
34 -
 35
35 -
 36
36 -
 37
37 -
 38
38 -
 39
39 -
 40
40 -
 41
41 -
 42
42 -
 43
43 -
 44
44 -
 45
45 -
 46
46 -
 47
47 -
 48
48 -
 49
49 -
 50
50 -
 51
51 -
 52
52 -
53
-
54
-
55
-
56
-
57
-
58
-
59
-
60
-
61
-
62
-
63
-
64
-
65
-
66
-
67
-
68
-
69
-
70
-
71
-
72
-
73
-
74
-
75
-
76
-
77
-
78
-
79
-
80
-
81
-
82
-
83
-
84
-
85
-
86
-
87
-
88
-
89
-
90
-
91
-
92
-
93
-
94
-
95
-
96
-
97
-
98
-
99
-
100
-
101
-
102
-
103
-
104
-
105
-
106
-
107
-
108
-
109
-
110
-
111
-
112
-
113
-
114
-
115
-
116
-
117
-
118
-
119
-
120
-
121
-
122
-
123
-
124
-
125
-
126
-
127
-
128
-
129
-
130
-
131
-
132
-
133
-
134
-
135
-
136
 |
 |

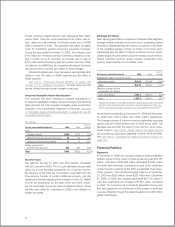
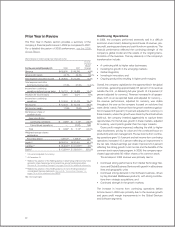
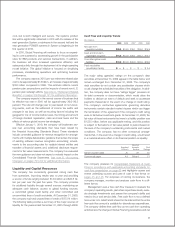
Prior Year in Review
The Prior Year in Review section provides a summary of the
company’s financial performance in 2008 as compared to 2007.
For a detailed discussion of 2008 performance, see the 2008
Annual Report.
($ and shares in millions except per share amounts)
Yr.-to-Yr.
Percent/
Margin
For the year ended December 31: 2008 2007 Change
Revenue $103,630 $ 98,786 4.9%*
Gross profit margin 44.1% 42.2% 1.8 pts.
Total expense and other income $ 28,945 $ 27,240 6.3%
Total expense and other
income-to-revenue ratio 27.9% 27.6% 0.4 pts.
Income from continuing
operations before income taxes $ 16,715 $ 14,489 15.4%
Provision for income taxes 4,381 4,071 7.6%
Income from continuing
operations $ 12,334 $ 10,418 18.4%
Net income $ 12,334 $ 10,418 18.4%
Net income margin 11.9% 10.5% 1.4 pts.
Earnings per share of
common stock:
Assuming dilution:
Continuing operations $ 8.89+ $ 7.15+ 24.3%
Discontinued operations — (0.00) NM
Total $ 8.89+ $ 7.15+ 24.3%
Weighted-average shares
outstanding:
Assuming dilution 1,387.8+ 1,456.9+ (4.7)%
Assets** $109,524 $120,431 (9.1)%
Liabilities** $ 95,939++ $ 91,816++ 4.5%
Equity** $ 13,584++ $ 28,615++ (52.5)%
* 2.3 percent adjusted for currency.
** At December 31.
+ Reflects the adoption of the FASB guidance in determining whether instruments
granted in share-based payment transactions are participating securities.
See note B, “Accounting Changes,” on pages 79 to 82 for additional information.
++ Reflects the adoption of the FASB guidance on noncontrolling interests in
consolidated financial statements. See note B, “Accounting Changes,” on
pages 79 to 82 for additional information
NM—Not meaningful
Continuing Operations
In 2008, the company performed extremely well in a difficult
econ omic environment, delivering record levels of revenue, pre-
tax profit, earnings per share and cash flow from operations. The
financial performance reflected the continuing strength of the
company’s global model and the results of the ongoing trans-
formation of the business. The key elements of the company’s
transformation include:
• A continuing shift to higher value businesses;
• Investing for growth in the emerging markets;
• Global integration;
• Investing in innovation; and
• Ongoing productivity resulting in higher profit margins.
Overall, the company capitalized on the opportunities in the global
economies, generating approximately 65 percent of its revenue
outside the U.S., in delivering full-year growth of 4.9 percent (2
percent adjusted for currency). Revenue increased in all geogra-
phies, both on an as reported basis and adjusted for currency—
the revenue performance, adjusted for currency, was stable
throughout the year as the company focused on solutions that
meet clients’ needs. Revenue from the growth markets organiza-
tion increased 9.8 percent (10 percent adjusted for currency). In
these markets, where the growth was driven by the infrastructure
build-out, the company invested aggressively to capture these
opportunities. For the full year, growth in these markets, adjusted
for currency, was 8 points greater than the major markets.
Gross profit margins improved, reflecting the shift to higher
value businesses, pricing for value and the continued focus on
productivity and cost management. Pre-tax income from continu-
ing operations grew 15.4 percent and net income from continuing
operations increased 18.4 percent reflecting an improve ment in
the tax rate. Diluted earnings per share improved 24.3 percent
reflecting the strong growth in net income and the benefits of the
common stock repurchase program. In 2008, the company repur-
chased approximately 90 million shares of its common stock.
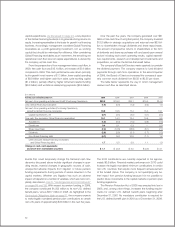
The increase in 2008 revenue was primarily due to:
• Continued strong performance from Global Technology Ser-
vices and Global Business Services with growth in all business
lines and geographic units;
• Continued strong demand in the Software business, driven
by Key Branded Middleware products, with strong contribu-
tions from strategic acquisitions; and
• Continued strength in the growth markets.
The increase in income from continuing operations before
income taxes in 2008 was primarily due to the revenue growth
and gross profit margin improvements in the Global Services
and Software segments.
40