IBM 2009 Annual Report Download - page 37
Download and view the complete annual report
Please find page 37 of the 2009 IBM annual report below. You can navigate through the pages in the report by either clicking on the pages listed below, or by using the keyword search tool below to find specific information within the annual report.-
 1
1 -
2
-
3
-
4
-
5
-
6
-
7
-
8
-
9
-
10
-
11
-
12
-
13
-
14
-
15
-
16
-
17
-
18
-
19
-
20
-
21
-
22
-
23
-
24
-
25
-
26
-
 27
27 -
 28
28 -
 29
29 -
 30
30 -
 31
31 -
 32
32 -
 33
33 -
 34
34 -
 35
35 -
 36
36 -
 37
37 -
 38
38 -
 39
39 -
 40
40 -
 41
41 -
 42
42 -
 43
43 -
 44
44 -
 45
45 -
 46
46 -
 47
47 -
48
-
49
-
50
-
51
-
52
-
53
-
54
-
55
-
56
-
57
-
58
-
59
-
60
-
61
-
62
-
63
-
64
-
65
-
66
-
67
-
68
-
69
-
70
-
71
-
72
-
73
-
74
-
75
-
76
-
77
-
78
-
79
-
80
-
81
-
82
-
83
-
84
-
85
-
86
-
87
-
88
-
89
-
90
-
91
-
92
-
93
-
94
-
95
-
96
-
97
-
98
-
99
-
100
-
101
-
102
-
103
-
104
-
105
-
106
-
107
-
108
-
109
-
110
-
111
-
112
-
113
-
114
-
115
-
116
-
117
-
118
-
119
-
120
-
121
-
122
-
123
-
124
-
125
-
126
-
127
-
128
-
129
-
130
-
131
-
132
-
133
-
134
-
135
-
136
 |
 |

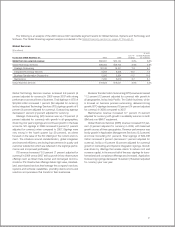
Consistent with accounting standards, the company remea-
sures the funded status of its retirement and postretirement
plans at December 31. The funded status is measured as the
difference between the fair value of the plan assets and the ben-
efit obligation and is recognized in the Consolidated Statement
of Financial Position. At December 31, 2009, primarily as a result
of improved returns on plan assets, the overall net underfunded
position decreased $4,667 million from December 31, 2008, to
a net underfunded position of $13,818 million. This change is
primarily reflected in prepaid pension assets and retirement and
nonpension postretirement benefit obligations which increased
$1,401 million and decreased $3,500 million, respectively, from
year-end 2008 levels. Due to the improvement in the equity
markets in 2009, the return on the U.S. Personal Pension Plan
assets was 11 percent, compared to a negative 15 percent in
2008. The company’s asset return in the non-U.S. plans was
approximately 14 percent compared to a negative 21 percent in
2008. At December 31, 2009, the company’s qualified defined
benefit plans worldwide were 99 percent funded with the U.S.
qualified Personal Pension Plan 101 percent funded.
In addition, total equity increased $9,170 million, net of tax,
primarily as a result of an improvement in retained earnings of
$10,546 million driven by current year net income, partially offset
by net stock transactions which declined $4,390 million primarily
due to common stock repurchases.
The assets and debt associated with the Global Financing
business are a significant part of the company’s financial posi-
tion. The financial position amounts appearing on page 65
are the consolidated amounts including Global Financing. The
amounts appearing in the separate Global Financing section
on pages 57 through 61 are supplementary data presented to
facilitate an understanding of the Global Financing business.
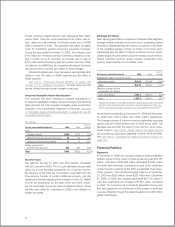
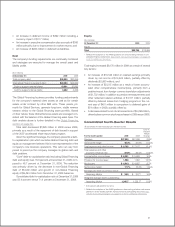
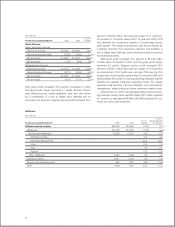
Working Capital
($ in millions)
At December 31: 2009 2008
Current assets $48,935 $49,004
Current liabilities 36,002 42,435
Working capital $12,933 $ 6,568
Current ratio 1.36 1.15
Working capital increased $6,365 million compared to the prior
year primarily as a result of a net decrease in current liabilities.
The key drivers are described below:
Current assets decreased $68 million due to:
• An increase of $1,066 million in cash and cash equivalents
and marketable securities (see Cash Flow analysis below
and on page 36); partially offset by;
• A decrease of $1,541 million in short-term receivables, offset
by a currency benefit of $779 million, driven by short-term
financing receivables due to lower volumes;
• A decrease of $353 million in prepaid expenses and other
current assets primarily resulting from:
– a decrease of $500 million in derivative assets as a result of
changes in foreign currency rates primarily driven by instru-
ments in cash flow hedging relationships; partially offset by;
– an increase of approximately $236 million in services pre-
paid and deferred transition costs; and
– a currency benefit of $135 million.
Current liabilities decreased $6,433 million as a result of:
• A decrease in short-term debt of $7,068 million primarily
driven by:
– $12,123 million in payments; partially offset by;
– reclasses of $2,282 million from long-term to short-term
debt to reflect maturity dates; and
– $3,502 million in new debt issuances.
• A decrease of $1,357 million in other accrued expenses and
liabilities primarily due to:
– a decrease of $508 million in derivative liabilities as a result
of changes in foreign currency rates primarily for certain
economic hedges;
– a decrease of $349 million in workforce reduction accru-
als; and
– a decrease of $218 million in deferred tax liabilities; partially
offset by;
• An increase of $1,083 million in taxes payable as a result of
a reclass from noncurrent liabilities related to uncertain tax
benefits and higher pre-tax income;
• An increase of $606 million in deferred income mainly driven
by a currency impact of approximately $329 million; and
• An increase of $423 million in accounts payable including a
currency impact of $131 million.
Cash Flow
The company’s cash flow from operating, investing and financ-
ing activities, as reflected in the Consolidated Statement of Cash
Flows on page 66, is summarized in the following table. These
amounts include the cash flows associated with the Global
Financing business.
35