IBM 2009 Annual Report Download - page 29
Download and view the complete annual report
Please find page 29 of the 2009 IBM annual report below. You can navigate through the pages in the report by either clicking on the pages listed below, or by using the keyword search tool below to find specific information within the annual report.-
 1
1 -
2
-
3
-
4
-
5
-
6
-
7
-
8
-
9
-
10
-
11
-
12
-
13
-
14
-
15
-
16
-
17
-
18
-
 19
19 -
 20
20 -
 21
21 -
 22
22 -
 23
23 -
 24
24 -
 25
25 -
 26
26 -
 27
27 -
 28
28 -
 29
29 -
 30
30 -
 31
31 -
 32
32 -
 33
33 -
 34
34 -
 35
35 -
 36
36 -
 37
37 -
 38
38 -
 39
39 -
40
-
41
-
42
-
43
-
44
-
45
-
46
-
47
-
48
-
49
-
50
-
51
-
52
-
53
-
54
-
55
-
56
-
57
-
58
-
59
-
60
-
61
-
62
-
63
-
64
-
65
-
66
-
67
-
68
-
69
-
70
-
71
-
72
-
73
-
74
-
75
-
76
-
77
-
78
-
79
-
80
-
81
-
82
-
83
-
84
-
85
-
86
-
87
-
88
-
89
-
90
-
91
-
92
-
93
-
94
-
95
-
96
-
97
-
98
-
99
-
100
-
101
-
102
-
103
-
104
-
105
-
106
-
107
-
108
-
109
-
110
-
111
-
112
-
113
-
114
-
115
-
116
-
117
-
118
-
119
-
120
-
121
-
122
-
123
-
124
-
125
-
126
-
127
-
128
-
129
-
130
-
131
-
132
-
133
-
134
-
135
-
136
 |
 |

Global Technology Services revenue of $37,347 million
decreased 4.9 percent (2 percent adjusted for currency) in 2009
versus 2008. Total GTS signings of $34,703 million in 2009 were
flat (increased 3 percent adjusted for currency) versus 2008.
Outsourcing signings of $25,507 million increased 4.3 percent
(8 percent adjusted for currency) with growth of 7 percent in the
major markets and 14 percent in the growth markets, adjusted
for currency. Integrated Technology Services signings of $9,196
million decreased 10.3 percent (8 percent adjusted for currency).
Strategic Outsourcing (SO) revenue decreased 4.2 percent (1
percent adjusted for currency). SO revenue performance, adjusted
for currency, was consistent throughout the year, although impac-
ted by reduced volumes in the existing client base. SO signings
increased 1.8 percent (6 percent adjusted for currency) when
compared to 2008. Revenue trends in outsourcing should
improve in 2010 as a result of the 2009 signings performance.
Integrated Technology Services (ITS) revenue decreased
5.5 percent (3 percent adjusted for currency) in 2009 versus
2008. Revenue performance largely reflects recent signings
performance which continued to be impacted by declines in
OEM offerings, as the ITS portfolio shifts to higher value, higher
margin offerings.
Business Transformation Outsourcing (BTO) revenue de creased
10.6 percent (6 percent adjusted for currency) year to year and
reflects declines in client business volumes in a slower economic
environment and an increased focus on deal selectivity. BTO
signings increased 21.9 percent (26 percent adjusted for cur-
rency) in 2009 compared to 2008.
Global Business Services revenue decreased 10.1 percent
(8 percent adjusted for currency) in 2009 driven primarily by a
double-digit decline in Consulting and Systems Integration rev-
enue. Total signings in GBS decreased 0.4 percent (increased 1
percent adjusted for currency). Application Outsourcing signings
increased 27.1 percent (25 percent adjusted for currency), illus-
trating the strong value proposition Application Outsourcing can
provide to clients with compelling cost savings. Consulting and
Systems Integration signings decreased 10.2 percent (8 percent
adjusted for currency).
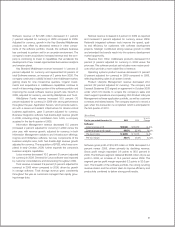
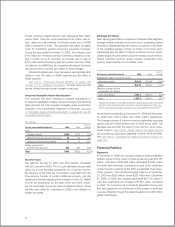
($ in millions)
Yr.-to-Yr.
For the year ended December 31: 2009 2008 Change
Global Services:
Global Technology Services:
External gross profit $13,081 $12,802 2.2%
External gross profit margin 35.0% 32.6% 2.4 pts.
Pre-tax income $ 5,537 $ 4,607 20.2%
Pre-tax margin 14.3% 11.3% 3.0 pts.
Global Business Services:
External gross profit $ 4,979 $ 5,238 (4.9)%
External gross profit margin 28.2% 26.7% 1.5 pts.
Pre-tax income $ 2,555 $ 2,681 (4.7)%
Pre-tax margin 13.8% 13.0% 0.8 pts.
GTS gross profit margin improved 2.4 points to 35.0 percent in
2009 and expanded in all lines of business when compared to
2008. Strategic Outsourcing gross margin improved for the fifth
con secutive year, while also improving overall service delivery
quality. This has been accomplished through a disciplined and
inno vative approach to delivery focused on both labor and non-
labor productivity actions. GTS has been executing a strategy to
deliver services out of key global delivery centers using consis-
tent global delivery methods and processes. The delivery centers
are also improving labor utilization with analytics and by applying
supply chain tools and techniques to the labor base. Integrated
Technology Services gross margin improved as the result of mix-
ing the portfolio to more profitable labor-based services. Business
Transformation Outsourcing gross margin expanded as a result of
improved deal selectivity and delivery performance. Segment pre-
tax profit increased 20.2 percent to $5,537 million with a pre-tax
margin of 14.3 percent, an increase of 3.0 points versus 2008.
GBS gross profit margin improved 1.5 points to 28.2 percent
in 2009 with an improving margin trend throughout the year.
Segment pre-tax profit was down 4.7 percent to $2,555 million,
however, margin improved 0.8 points year over year. Throughout
the year, the dynamic GBS delivery model enabled solid profit
performance in a tough economic climate. The pre-tax margin
expansion also included improving trends throughout the year
and was driven primarily by improved delivery center utiliza-
tion, reduced subcontractor spending and improved cost and
expense management.
GLOBAL SERVICES SIGNINGS
The table on page 28 presents Global Services signings as
reported. Signings at actual currency rates provide investors
with a better view of how these signings will convert to services
revenue and also provides better comparability to other compa-
nies in the industry who report signings using actual rates.
27