IBM 2009 Annual Report Download - page 121
Download and view the complete annual report
Please find page 121 of the 2009 IBM annual report below. You can navigate through the pages in the report by either clicking on the pages listed below, or by using the keyword search tool below to find specific information within the annual report.-
 1
1 -
2
-
3
-
4
-
5
-
6
-
7
-
8
-
9
-
10
-
11
-
12
-
13
-
14
-
15
-
16
-
17
-
18
-
19
-
20
-
21
-
22
-
23
-
24
-
25
-
26
-
27
-
28
-
29
-
30
-
31
-
32
-
33
-
34
-
35
-
36
-
37
-
38
-
39
-
40
-
41
-
42
-
43
-
44
-
45
-
46
-
47
-
48
-
49
-
50
-
51
-
52
-
53
-
54
-
55
-
56
-
57
-
58
-
59
-
60
-
61
-
62
-
63
-
64
-
65
-
66
-
67
-
68
-
69
-
70
-
71
-
72
-
73
-
74
-
75
-
76
-
77
-
78
-
79
-
80
-
81
-
82
-
83
-
84
-
85
-
86
-
87
-
88
-
89
-
90
-
91
-
92
-
93
-
94
-
95
-
96
-
97
-
98
-
99
-
100
-
101
-
102
-
103
-
104
-
105
-
106
-
107
-
108
-
109
-
110
-
 111
111 -
 112
112 -
 113
113 -
 114
114 -
 115
115 -
 116
116 -
 117
117 -
 118
118 -
 119
119 -
 120
120 -
 121
121 -
 122
122 -
 123
123 -
 124
124 -
 125
125 -
 126
126 -
 127
127 -
 128
128 -
 129
129 -
 130
130 -
 131
131 -
132
-
133
-
134
-
135
-
136
 |
 |

Notes to Consolidated Financial Statements
INTERNATIONAL BUSINESS MACHINES CORPORATION AND SUBSIDIARY COMPANIES
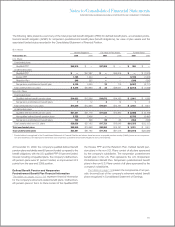
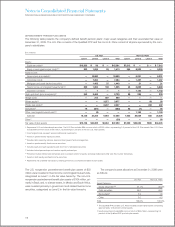
The following table presents the reconciliation of the beginning and ending balances of Level 3 assets for the year ended December
31, 2009 for the U.S. Plan:
($ in millions)
Equity Mortgage Fixed
Commingled/ And Income Private
Mutual Asset-Backed Commingled/ Hedge Private Real
Funds Securities Mutual Funds Funds Equity Estate Total
Balance at January 1 $ — $47 $180 $513 $3,169 $2,698 $6,607
Return on assets held at end of year 1 11 11 80 575 (634) 44
Return on assets sold during the year — 1 — 2 14 (98) (81)
Purchases, sales and settlements, net 25 (7) — (8) 118 281 408
Transfers, net — (14) — — — — (14)
Balance at December 31 $26 $37 $192 $587 $3,877 $2,247 $6,964
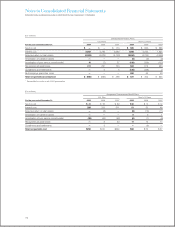
The following table presents the reconciliation of the beginning and ending balances of Level 3 assets for the year ended December
31, 2009 for the non-U.S. Plans:
($ in millions)
Private Private
Equity Real Estate Total
Balance at January 1 $ 64 $429 $494
Return on assets held at end of year (10) (10) (19)
Return on assets sold during the year — — 1
Purchases, sales and settlements, net 32 27 59
Transfers, net — — —
Foreign exchange impact 6 46 51
Balance at December 31 $ 93 $492 $585
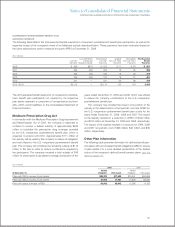
VALUATION TECHNIQUES
The following is a description of the valuation techniques used
to measure plan assets at fair value. There were no changes in
valuation techniques during 2009 and 2008.
Equity securities are valued at the closing price reported on
the stock exchange on which the individual securities are traded.
IBM common stock is valued at the closing price reported on the
New York Stock Exchange. Equity commingled/mutual funds
are typically valued using the net asset value (NAV) provided by
the administrator of the fund and reviewed by the company. The
NAV is based on the value of the underlying assets owned by
the fund, minus liabilities and divided by the number of shares or
units outstanding. These assets are classified as Level 1, Level 2
or Level 3 depending on availability of quoted market prices.
The fair value of fixed income securities is typically estimated
using pricing models, quoted prices of securities with similar
characteristics or discounted cash flows and are generally clas-
sified as Level 2. If available, they are valued using the closing
price reported on the major market on which the individual
securities are traded.
Cash includes money market accounts that are valued at
their cost plus interest on a daily basis, which approximates fair
value. Short-term investments represent securities with original
maturities of one year or less. These assets are classified as Level
1 or Level 2.
Private equity and private real estate partnership valuations
require significant judgment due to the absence of quoted mar-
ket prices, the inherent lack of liquidity and the long-term nature
of such assets. These assets are initially valued at cost and are
reviewed periodically utilizing available and relevant market data
to determine if the carrying value of these assets should be
adjusted. These investments are classified as Level 3. The valu-
ation methodology is applied consistently from period to period.
119