IBM 2009 Annual Report Download - page 110
Download and view the complete annual report
Please find page 110 of the 2009 IBM annual report below. You can navigate through the pages in the report by either clicking on the pages listed below, or by using the keyword search tool below to find specific information within the annual report.-
 1
1 -
2
-
3
-
4
-
5
-
6
-
7
-
8
-
9
-
10
-
11
-
12
-
13
-
14
-
15
-
16
-
17
-
18
-
19
-
20
-
21
-
22
-
23
-
24
-
25
-
26
-
27
-
28
-
29
-
30
-
31
-
32
-
33
-
34
-
35
-
36
-
37
-
38
-
39
-
40
-
41
-
42
-
43
-
44
-
45
-
46
-
47
-
48
-
49
-
50
-
51
-
52
-
53
-
54
-
55
-
56
-
57
-
58
-
59
-
60
-
61
-
62
-
63
-
64
-
65
-
66
-
67
-
68
-
69
-
70
-
71
-
72
-
73
-
74
-
75
-
76
-
77
-
78
-
79
-
80
-
81
-
82
-
83
-
84
-
85
-
86
-
87
-
88
-
89
-
90
-
91
-
92
-
93
-
94
-
95
-
96
-
97
-
98
-
99
-
 100
100 -
 101
101 -
 102
102 -
 103
103 -
 104
104 -
 105
105 -
 106
106 -
 107
107 -
 108
108 -
 109
109 -
 110
110 -
 111
111 -
 112
112 -
 113
113 -
 114
114 -
 115
115 -
 116
116 -
 117
117 -
 118
118 -
 119
119 -
 120
120 -
121
-
122
-
123
-
124
-
125
-
126
-
127
-
128
-
129
-
130
-
131
-
132
-
133
-
134
-
135
-
136
 |
 |

Notes to Consolidated Financial Statements
INTERNATIONAL BUSINESS MACHINES CORPORATION AND SUBSIDIARY COMPANIES
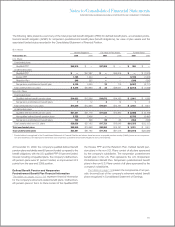
RSUs
2009 2008 2007
Wtd. Avg. Number Wtd. Avg. Number Wtd. Avg. Number
Grant Price of Units Grant Price of Units Grant Price of Units
Balance at January 1 $100 12,397,515 $ 94 11,887,746 $ 84 10,217,258
RSUs granted 105 4,432,449 107 4,587,011 104 4,929,141
RSUs released 99 (2,748,613) 88 (3,526,580) 77 (2,747,110)
RSUs canceled/forfeited 101 (675,697) 98 (550,662) 88 (511,543)
Balance at December 31 $102 13,405,654 $100 12,397,515 $ 94 11,887,746
PSUs
2009 2008 2007
Wtd. Avg. Number Wtd. Avg. Number Wtd. Avg. Number
Grant Price of Units Grant Price of Units Grant Price of Units
Balance at January 1 $102 3,078,694 $ 93 2,783,823 $ 89 2,417,378
PSUs granted at target 101 1,568,129 119 1,058,381 103 1,156,708
Additional shares earned above target* 83 396,794 91 275,190 95 216,826
PSUs released 83 (1,440,099) 91 (860,705) 96 (926,386)
PSUs canceled/forfeited 111 (126,781) 102 (177,995) 90 (80,703)
Balance at December 31** $107 3,476,737 $102 3,078,694 $ 93 2,783,823
* Represents additional shares issued to employees after vesting of PSUs because final performance metrics exceeded specified targets.
** Represents the number of shares expected to be issued based on achievement of grant date performance targets. The actual number of shares issued depends on the
company’s performance against specified targets over the vesting period.
The remaining weighted-average contractual term of RSUs at
December 31, 2009, 2008 and 2007 is the same as the period
over which the remaining cost of the awards will be recognized,
which is approximately three years. The fair value of RSUs
granted during the years ended December 31, 2009, 2008 and
2007 was $467 million, $490 million and $513 million, respec-
tively. The total fair value of RSUs vested and released during the
years ended December 31, 2009, 2008 and 2007 was $272 mil-
lion, $311 million and $213 million, respectively. As of December
31, 2009, 2008 and 2007, there was $892 million, $863 million
and $740 million, respectively, of unrecognized compensation
cost related to non-vested RSUs. The company received no cash
from employees as a result of employee vesting and release of
RSUs for the years ended December 31, 2009, 2008 and 2007.
PSUs are stock awards where the number of shares ulti-
mately received by the employee depends on the company’s
performance against specified targets and typically vest over
a three-year period. The fair value of each PSU is determined
on the grant date, based on the company’s stock price, and
assumes that performance targets will be achieved. Over the
performance period, the number of shares of stock that will
be issued is adjusted upward or downward based upon the
probability of achievement of performance targets. The ultimate
number of shares issued and the related compensation cost
recognized as expense will be based on a comparison of the
final performance metrics to the specified targets. The fair value
of PSUs granted during the years ended December 31, 2009,
2008 and 2007 was $159 million, $126 million and $116 million,
respectively. Total fair value of PSUs vested and released during
the years ended December 31, 2009, 2008 and 2007 was $120
million, $78 million and $88 million, respectively.
In connection with vesting and release of RSUs and PSUs,
the tax benefits realized by the company for the years ended
December 31, 2009, 2008 and 2007 were $156 million, $165
million and $133 million, respectively.
IBM Employees Stock Purchase Plan
The company maintains a non-compensatory Employees Stock
Pur chase Plan (ESPP). The ESPP enables eligible participants
to purchase full or fractional shares of IBM common stock at a
five-percent discount off the average market price on the day
of purchase through payroll deductions of up to 10 percent
of eligible compensation. Eligible compensation includes any
compensation received by the employee during the year. The
ESPP provides for offering periods during which shares may
be purchased and continues as long as shares remain available
under the ESPP, unless terminated earlier at the discretion of the
Board of Directors. Individual ESPP participants are restricted
from purchasing more than $25,000 of common stock in one
calendar year or 1,000 shares in an offering period.
108