IBM 2009 Annual Report Download - page 124
Download and view the complete annual report
Please find page 124 of the 2009 IBM annual report below. You can navigate through the pages in the report by either clicking on the pages listed below, or by using the keyword search tool below to find specific information within the annual report.-
 1
1 -
2
-
3
-
4
-
5
-
6
-
7
-
8
-
9
-
10
-
11
-
12
-
13
-
14
-
15
-
16
-
17
-
18
-
19
-
20
-
21
-
22
-
23
-
24
-
25
-
26
-
27
-
28
-
29
-
30
-
31
-
32
-
33
-
34
-
35
-
36
-
37
-
38
-
39
-
40
-
41
-
42
-
43
-
44
-
45
-
46
-
47
-
48
-
49
-
50
-
51
-
52
-
53
-
54
-
55
-
56
-
57
-
58
-
59
-
60
-
61
-
62
-
63
-
64
-
65
-
66
-
67
-
68
-
69
-
70
-
71
-
72
-
73
-
74
-
75
-
76
-
77
-
78
-
79
-
80
-
81
-
82
-
83
-
84
-
85
-
86
-
87
-
88
-
89
-
90
-
91
-
92
-
93
-
94
-
95
-
96
-
97
-
98
-
99
-
100
-
101
-
102
-
103
-
104
-
105
-
106
-
107
-
108
-
109
-
110
-
111
-
112
-
113
-
 114
114 -
 115
115 -
 116
116 -
 117
117 -
 118
118 -
 119
119 -
 120
120 -
 121
121 -
 122
122 -
 123
123 -
 124
124 -
 125
125 -
 126
126 -
 127
127 -
 128
128 -
 129
129 -
 130
130 -
 131
131 -
 132
132 -
 133
133 -
 134
134 -
135
-
136
 |
 |

Notes to Consolidated Financial Statements
INTERNATIONAL BUSINESS MACHINES CORPORATION AND SUBSIDIARY COMPANIES
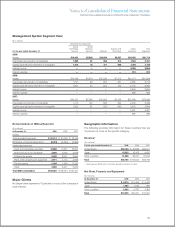
Note V.
Segment Information
The company creates business value for clients and solves
business problems through integrated solutions that leverage
information technology and deep knowledge of business pro-
cesses. IBM solutions typically create value by reducing a client’s
operational costs or by enabling new capabilities that generate
revenue. These solutions draw from an industry-leading portfolio
of consulting, delivery and implementation services, enterprise
software, systems and financing.
The company’s major operations comprise: a Global Tech-
nol ogy Services segment; a Global Business Services segment;
a Software segment; a Systems and Technology segment; and a
Global Financing segment. The segments repre sent components
of the company for which separate financial information is available
that is utilized on a regular basis by the chief executive officer in
determining how to allocate the company’s resources and evalu-
ate performance. The segments are determined based on several
factors, including client base, homogeneity of products, technol-
ogy, delivery channels and similar economic characteristics.
Information about each segment’s business and the products
and services that generate each segment’s revenue is located
in the “Description of Business” section of the Management
Dis cus sion on pages 20 to 25, and “Segment Details,” on pages
25 to 31.
Segment revenue and pre-tax income include transactions
between the segments that are intended to reflect an arm’s-length
transfer price. Systems and software that is used by the Global
Technology Services segment in outsourcing engagements is pri-
marily sourced internally from the Systems and Technology and
Software segments. For the internal use of IT services, Global
Technology Services and Global Business Services recover cost,
as well as a reasonable fee, reflecting the arm’s-length value of
providing the services. The Global Services segments enter into
arm’s-length leases and loans at prices equivalent to market rates
with the Global Financing segment to facilitate the acquisition of
equipment used in services engagements. All internal transaction
prices are reviewed annually, and reset if appropriate.
The company utilizes globally integrated support orga-
nizations to realize economies of scale and efficient use of
resources. As a result, a considerable amount of expense is
shared by all of the segments. This shared expense includes
sales coverage, marketing and support functions such as
Accounting, Treasury, Procurement, Legal, Human Re sources
and Billing and Collections. Where practical, shared expenses
are allocated based on measurable drivers of expense, e.g.,
headcount. When a clear and measurable driver cannot be
identified, shared expenses are allocated on a financial basis
that is consistent with the company’s management system; e.g.,
advertising expense is allocated based on the gross profits of
the segments. The unallocated corporate amounts arising from
certain divestitures, indirect infrastructure reductions, miscella-
neous tax items and the unallocated corporate expense pool are
recorded in net income but are not allocated to the segments.
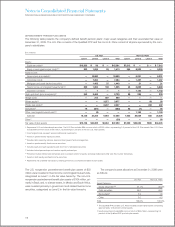
The following tables reflect the results of continuing operations
of the segments consistent with the company’s management and
measurement system. These results are not necessarily a depic-
tion that is in conformity with GAAP. Performance measurement
is based on pre-tax income. These results are used, in part, by
senior management, both in evaluating the performance of, and
in allocating resources to, each of the segments.
122