IBM 2009 Annual Report Download - page 106
Download and view the complete annual report
Please find page 106 of the 2009 IBM annual report below. You can navigate through the pages in the report by either clicking on the pages listed below, or by using the keyword search tool below to find specific information within the annual report.-
 1
1 -
2
-
3
-
4
-
5
-
6
-
7
-
8
-
9
-
10
-
11
-
12
-
13
-
14
-
15
-
16
-
17
-
18
-
19
-
20
-
21
-
22
-
23
-
24
-
25
-
26
-
27
-
28
-
29
-
30
-
31
-
32
-
33
-
34
-
35
-
36
-
37
-
38
-
39
-
40
-
41
-
42
-
43
-
44
-
45
-
46
-
47
-
48
-
49
-
50
-
51
-
52
-
53
-
54
-
55
-
56
-
57
-
58
-
59
-
60
-
61
-
62
-
63
-
64
-
65
-
66
-
67
-
68
-
69
-
70
-
71
-
72
-
73
-
74
-
75
-
76
-
77
-
78
-
79
-
80
-
81
-
82
-
83
-
84
-
85
-
86
-
87
-
88
-
89
-
90
-
91
-
92
-
93
-
94
-
95
-
 96
96 -
 97
97 -
 98
98 -
 99
99 -
 100
100 -
 101
101 -
 102
102 -
 103
103 -
 104
104 -
 105
105 -
 106
106 -
 107
107 -
 108
108 -
 109
109 -
 110
110 -
 111
111 -
 112
112 -
 113
113 -
 114
114 -
 115
115 -
 116
116 -
117
-
118
-
119
-
120
-
121
-
122
-
123
-
124
-
125
-
126
-
127
-
128
-
129
-
130
-
131
-
132
-
133
-
134
-
135
-
136
 |
 |

Notes to Consolidated Financial Statements
INTERNATIONAL BUSINESS MACHINES CORPORATION AND SUBSIDIARY COMPANIES
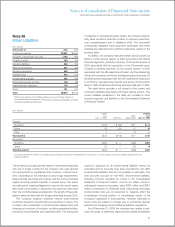
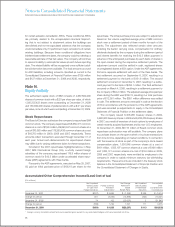
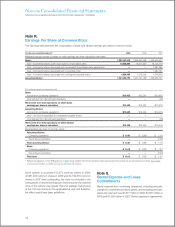
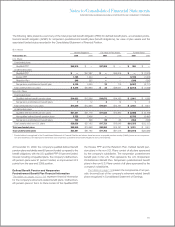
Note R.
Earnings Per Share of Common Stock
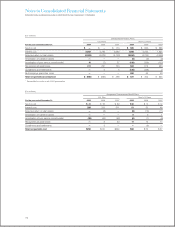
The following table presents the computation of basic and diluted earnings per share of common stock.
For the year ended December 31: 2009 2008 2007
Weighted-average number of shares on which earnings per share calculations are based:
Basic: 1,327,157,410 1,369,367,069* 1,433,935,221*
Add — incremental shares under stock-based compensation plans 12,258,864 16,617,801* 18,145,715*
Add — incremental shares associated with Accelerated Share Repurchase agreements — — 1,891,095
Add — incremental shares associated with convertible notes — — 1,362,191
Add — incremental shares associated with contingently issuable shares 1,936,480 1,812,328 1,546,529
Assuming dilution 1,341,352,754 1,387,797,198* 1,456,880,751*
($ in millions except per share amounts)
Basic:
Income from continuing operations $13,425 $12,334 $10,418
Income/(loss) from discontinued operations — — (00)
Net income from total operations on which basic
earnings per share is calculated $13,425 $12,334 $10,418
Assuming dilution:
Income from continuing operations $13,425 $12,334 $10,418
Less — net income applicable to contingently issuable shares — 1 —
Income/(loss) from discontinued operations — — (00)
Net income from total operations on which diluted
earnings per share is calculated $13,425 $12,333 $10,418
Earnings/(loss) per share of common stock:
Assuming dilution:
Continuing operations $ 10.01 $ 8.89* $ 7.15*
Discontinued operations — — (0.00)
Total assuming dilution $ 10.01 $ 8.89* $ 7.15*
Basic:
Continuing operations $ 10.12 $ 9.02* $ 7.27*
Discontinued operations — — (0.00)
Total basic $ 10.12 $ 9.02* $ 7.27*
* Reflects the adoption of the FASB guidance in determining whether instruments granted in share-based payment transactions are participating securities. See note B,
“Accounting Changes,” on pages 79 to 82 for additional information.
Stock options to purchase 612,272 common shares in 2009,
42,981,463 common shares in 2008 and 62,782,516 common
shares in 2007 were outstanding, but were not included in the
computation of diluted earnings per share because the exercise
price of the options was greater than the average market price
of the common shares for the applicable full year, and therefore,
the effect would have been antidilutive.
Note S.
Rental Expense and Lease
Commitments
Rental expense from continuing operations, including amounts
charged to inventories and fixed assets, and excluding amounts
previously reserved, was $1,677 million in 2009, $1,681 million in
2008 and $1,559 million in 2007. Rental expense in agreements
104