IBM 2009 Annual Report Download - page 123
Download and view the complete annual report
Please find page 123 of the 2009 IBM annual report below. You can navigate through the pages in the report by either clicking on the pages listed below, or by using the keyword search tool below to find specific information within the annual report.-
 1
1 -
2
-
3
-
4
-
5
-
6
-
7
-
8
-
9
-
10
-
11
-
12
-
13
-
14
-
15
-
16
-
17
-
18
-
19
-
20
-
21
-
22
-
23
-
24
-
25
-
26
-
27
-
28
-
29
-
30
-
31
-
32
-
33
-
34
-
35
-
36
-
37
-
38
-
39
-
40
-
41
-
42
-
43
-
44
-
45
-
46
-
47
-
48
-
49
-
50
-
51
-
52
-
53
-
54
-
55
-
56
-
57
-
58
-
59
-
60
-
61
-
62
-
63
-
64
-
65
-
66
-
67
-
68
-
69
-
70
-
71
-
72
-
73
-
74
-
75
-
76
-
77
-
78
-
79
-
80
-
81
-
82
-
83
-
84
-
85
-
86
-
87
-
88
-
89
-
90
-
91
-
92
-
93
-
94
-
95
-
96
-
97
-
98
-
99
-
100
-
101
-
102
-
103
-
104
-
105
-
106
-
107
-
108
-
109
-
110
-
111
-
112
-
 113
113 -
 114
114 -
 115
115 -
 116
116 -
 117
117 -
 118
118 -
 119
119 -
 120
120 -
 121
121 -
 122
122 -
 123
123 -
 124
124 -
 125
125 -
 126
126 -
 127
127 -
 128
128 -
 129
129 -
 130
130 -
 131
131 -
 132
132 -
 133
133 -
134
-
135
-
136
 |
 |

Notes to Consolidated Financial Statements
INTERNATIONAL BUSINESS MACHINES CORPORATION AND SUBSIDIARY COMPANIES
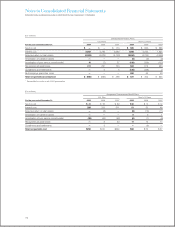
NONPENSION POSTRETIREMENT BENEFIT PLAN
EXPECTED PAYMENTS
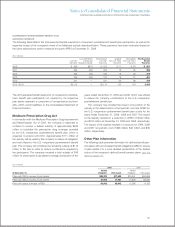
The following table reflects the total expected benefit payments to nonpension postretirement benefit plan participants, as well as the
expected receipt of the company’s share of the Medicare subsidy described below. These payments have been estimated based on
the same assumptions used to measure the plan’s APBO at December 31, 2009.
($ in millions)
Less: IBM Share Net Expected Qualified Nonqualified Total Expected
U.S. Plan of Expected U.S. Plan Non-U.S. Plans Non-U.S. Plans Benefit
Payments Medicare Subsidy Payments Payments Payments Payments
2010 $ 499 $(27) $ 472 $ 11 $ 24 $ 507
2011 492 (28) 464 15 25 503
2012 458 (28) 430 16 26 472
2013 440 (28) 412 18 27 457
2014 431 — 431 20 28 479
2015
–
2019 $2,113 — $2,113 135 154 2,402
The 2010 expected benefit payments to nonpension postretire-
ment benefit plan participants not covered by the respective
plan assets represent a component of compensation and ben-
efits, within current liabilities, in the Consolidated Statement of
Financial Position.
Medicare Prescription Drug Act
In connection with the Medicare Prescription Drug Improvement
and Modernization Act of 2003, the company is expected to
continue to receive a federal subsidy of approximately $229
million to subsidize the prescription drug coverage provided
by the U.S. nonpension postretirement benefit plan, which is
expected to extend until 2013. Approx imately $111 million of
the subsidy will be used by the company to reduce its obligation
and cost related to the U.S. nonpension postretirement benefit
plan. The company will contribute the remaining subsidy of $118
million to the plan in order to reduce contributions required by
the participants. The company received a total subsidy of $45
million for prescription drug-related coverage during each of the
years ended December 31, 2009 and 2008, which was utilized
to reduce the company contributions to the U.S. nonpension
postretirement benefit plan.
The company has included the impact of its portion of the
subsidy in the determination of net periodic cost and APBO for
the U.S. nonpension postretirement benefit plan at and for the
years ended December 31, 2009, 2008 and 2007. The impact
of the subsidy resulted in a reduction in APBO of $100 million
and $127 million at December 31, 2009 and 2008, respectively.
The impact of the subsidy resulted in a reduction in 2009, 2008
and 2007 net periodic cost of $28 million, $40 million and $36
million, respectively.
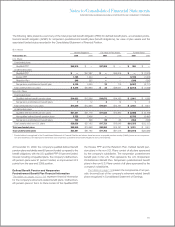
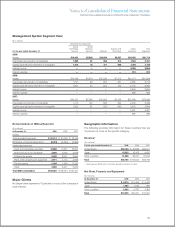
Other Plan Information
The following table presents information for defined benefit pen-
sion plans with accumulated benefit obligations (ABO) in excess
of plan assets. For a more detailed presentation of the funded
status of the company’s defined benefit pension plans, see the
table on page 113.
($ in millions)
2009 2008
Benefit Benefit
At December 31: Obligation Plan Assets Obligation Plan Assets
Plans with PBO in excess of plan assets $28,720 $17,633 $75,341 $60,898
Plans with ABO in excess of plan assets 27,996 17,561 73,939 60,630
Plans with assets in excess of PBO 60,942 63,942 12,586 14,183
121