IBM 2009 Annual Report Download - page 113
Download and view the complete annual report
Please find page 113 of the 2009 IBM annual report below. You can navigate through the pages in the report by either clicking on the pages listed below, or by using the keyword search tool below to find specific information within the annual report.-
 1
1 -
2
-
3
-
4
-
5
-
6
-
7
-
8
-
9
-
10
-
11
-
12
-
13
-
14
-
15
-
16
-
17
-
18
-
19
-
20
-
21
-
22
-
23
-
24
-
25
-
26
-
27
-
28
-
29
-
30
-
31
-
32
-
33
-
34
-
35
-
36
-
37
-
38
-
39
-
40
-
41
-
42
-
43
-
44
-
45
-
46
-
47
-
48
-
49
-
50
-
51
-
52
-
53
-
54
-
55
-
56
-
57
-
58
-
59
-
60
-
61
-
62
-
63
-
64
-
65
-
66
-
67
-
68
-
69
-
70
-
71
-
72
-
73
-
74
-
75
-
76
-
77
-
78
-
79
-
80
-
81
-
82
-
83
-
84
-
85
-
86
-
87
-
88
-
89
-
90
-
91
-
92
-
93
-
94
-
95
-
96
-
97
-
98
-
99
-
100
-
101
-
102
-
 103
103 -
 104
104 -
 105
105 -
 106
106 -
 107
107 -
 108
108 -
 109
109 -
 110
110 -
 111
111 -
 112
112 -
 113
113 -
 114
114 -
 115
115 -
 116
116 -
 117
117 -
 118
118 -
 119
119 -
 120
120 -
 121
121 -
 122
122 -
 123
123 -
124
-
125
-
126
-
127
-
128
-
129
-
130
-
131
-
132
-
133
-
134
-
135
-
136
 |
 |

Notes to Consolidated Financial Statements
INTERNATIONAL BUSINESS MACHINES CORPORATION AND SUBSIDIARY COMPANIES
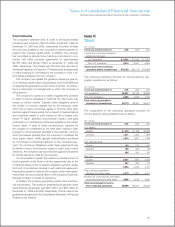
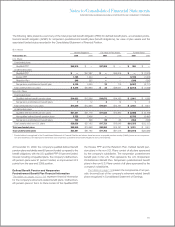
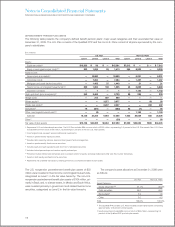
The following table presents a summary of the total projected benefit obligation (PBO) for defined benefit plans, accumulated postre-
tirement benefit obligation (APBO) for nonpension postretirement benefit plans (benefit obligations), fair value of plan assets and the
associated funded status recorded in the Consolidated Statement of Financial Position.
($ in millions)
Benefit Obligations Fair Value of Plan Assets Funded Status*
At December 31: 2009 2008 2009 2008 2009 2008
U.S. Plans:
Overfunded plans:
Qualified PPP $46,910 $ — $47,269 $ — $ 359 $ —
Underfunded plans:
Qualified PPP $ — $47,297 $ — $45,918 $ — $ (1,379)
Excess PPP 1,195 1,224 — — (1,195) (1,224)
Retention Plan 249 235 — — (249) (235)
Nonpension postretirement benefit plan 5,100 5,224 33 113 (5,067) (5,111)
Total underfunded U.S. plans $ 6,545 $53,980 $ 33 $46,031 $ (6,512) $ (7,949)
Non-U.S. Plans:
Overfunded plans:
Qualified defined benefit pension plans $14,032 $12,586 $16,673 $14,183 $ 2,641 $ 1,598
Nonpension postretirement benefit plans 7 12 8 14 1 3
Total overfunded non-U.S. plans $14,039 $12,598 $16,681 $14,197 $ 2,642 $ 1,601
Underfunded plans:
Qualified defined benefit pension plans $21,521 $21,179 $17,633 $14,980 $ (3,888) $ (6,199)
Nonqualified defined benefit pension plans 5,755 5,406 — — (5,755) (5,406)
Nonpension postretirement benefit plans 760 596 96 65 (664) (532)
Total underfunded non-U.S. plans $28,036 $27,182 $17,729 $15,045 $(10,307) $(12,137)
Total overfunded plans $60,949 $12,598 $63,950 $14,197 $ 3,001 $ 1,601
Total underfunded plans $34,581 $81,162 $17,762 $61,076 $(16,819) $(20,086)
* Funded status is recognized in the Consolidated Statement of Financial Position as follows: Asset amounts as prepaid pension assets; (Liability) amounts as compensa-
tion and benefits (current liability) and retirement and nonpension postretirement benefit obligations (noncurrent liability).
At December 31, 2009, the company’s qualified defined benefit
pension plans worldwide were 99 percent funded compared to the
benefit obligations, with the U.S. qualified PPP 101 percent funded.
Overall, including nonqualifed plans, the company’s defined ben-
efit pension plans were 91 percent funded, an improvement of 6
points from the year-end 2008 position.
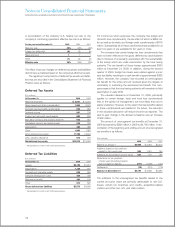
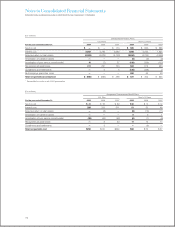
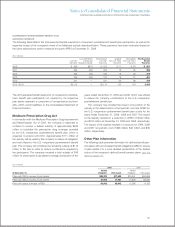
Defined Benefit Pension and Nonpension
Postretirement Benefit Plan Financial Information
The tables on pages 112 to 114 represent financial information
for the company’s retirement-related benefit plans. Defined ben-
efit pension plans in the U.S. Plans consist of the Qualified PPP,
the Excess PPP and the Retention Plan. Defined benefit pen-
sion plans in the non-U.S. Plans consist of all plans sponsored
by the company’s subsidiaries. The nonpension postretirement
benefit plan in the U.S. Plan represents the U.S. Non pension
Postretirement Benefit Plan. Nonpension postretirement benefit
plans in the non-U.S. Plans consist of all plans sponsored by the
company’s subsidiaries.
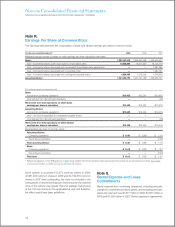
The tables on page 112 present the components of net peri-
odic (income)/cost of the company’s retirement-related benefit
plans recognized in Consoli dated Statement of Earnings.
111