IBM 2009 Annual Report Download - page 90
Download and view the complete annual report
Please find page 90 of the 2009 IBM annual report below. You can navigate through the pages in the report by either clicking on the pages listed below, or by using the keyword search tool below to find specific information within the annual report.-
 1
1 -
2
-
3
-
4
-
5
-
6
-
7
-
8
-
9
-
10
-
11
-
12
-
13
-
14
-
15
-
16
-
17
-
18
-
19
-
20
-
21
-
22
-
23
-
24
-
25
-
26
-
27
-
28
-
29
-
30
-
31
-
32
-
33
-
34
-
35
-
36
-
37
-
38
-
39
-
40
-
41
-
42
-
43
-
44
-
45
-
46
-
47
-
48
-
49
-
50
-
51
-
52
-
53
-
54
-
55
-
56
-
57
-
58
-
59
-
60
-
61
-
62
-
63
-
64
-
65
-
66
-
67
-
68
-
69
-
70
-
71
-
72
-
73
-
74
-
75
-
76
-
77
-
78
-
79
-
 80
80 -
 81
81 -
 82
82 -
 83
83 -
 84
84 -
 85
85 -
 86
86 -
 87
87 -
 88
88 -
 89
89 -
 90
90 -
 91
91 -
 92
92 -
 93
93 -
 94
94 -
 95
95 -
 96
96 -
 97
97 -
 98
98 -
 99
99 -
 100
100 -
101
-
102
-
103
-
104
-
105
-
106
-
107
-
108
-
109
-
110
-
111
-
112
-
113
-
114
-
115
-
116
-
117
-
118
-
119
-
120
-
121
-
122
-
123
-
124
-
125
-
126
-
127
-
128
-
129
-
130
-
131
-
132
-
133
-
134
-
135
-
136
 |
 |

Notes to Consolidated Financial Statements
INTERNATIONAL BUSINESS MACHINES CORPORATION AND SUBSIDIARY COMPANIES
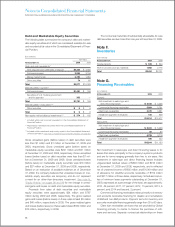
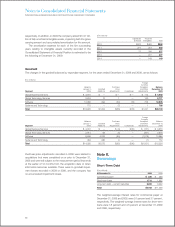
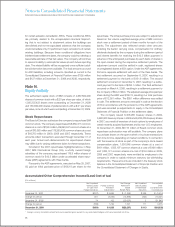
Debt and Marketable Equity Securities
The following table summarizes the company’s debt and market-
able equity securities all of which are considered available-for-sale
and re cord ed at fair value in the Consolidated Statement of Finan-
cial Position.
($ in millions)
Fair Value
At December 31: 2009 2008
Cash and cash equivalents:*
Time deposits and certificates of deposit $4,324 $ 4,805
Commercial paper 2,099 3,194
Money market funds 2,780 1,950
Other securities 74 60
Total $9,277 $10,009
Debt securities—current:**
Commercial paper $1,491 $ 166
Securities of U.S. Federal government
and its agencies 300 —
Total $1,791 $ 166
Debt securities—noncurrent:***
Other securities $ 9 $ 6
Total $ 9 $ 6
Non-equity method alliance investments*** $ 374 $ 165
* Included within cash and cash equivalents in the Consolidated Statement of
Financial Position.
** Reported as marketable securities within the Consolidated Statement of
Financial Position.
*** Included within investments and sundry assets in the Consolidated Statement
of Financial Position. See note I, “Investments and Sundry Assets,” on page 89.
Gross unrealized gains (before taxes) on debt securities were
less than $1 million and $1 million at December 31, 2009 and
2008, respectively. Gross unrealized gains (before taxes) on
marketable equity securities were $201 million and $31 million
at December 31, 2009 and 2008, respectively. Gross unrealized
losses (before taxes) on debt securities were less than $1 mil-
lion at December 31, 2009 and 2008. Gross unrealized losses
(before taxes) on marketable equity securities were $10 million
and $27 million at December 31, 2009 and 2008, respectively.
Based on an evaluation of available evidence as of December
31, 2009, the company believes that unrealized losses on mar-
ketable equity securities are temporary and do not represent
a need for an other-than-temporary impairment. See note N,
“Equity Activity,” on pages 98 and 99 for net change in unreal-
ized gains and losses on debt and marketable equity securities.
Proceeds from sales of debt securities and marketable
equity securities were approximately $24 million and $787
million during 2009 and 2008, respectively. The gross realized
gains and losses (before taxes) on these sales totaled $3 million
and $40 million, respectively in 2009. The gross realized gains
and losses (before taxes) on these sales totaled $182 million and
$13 million, respectively, in 2008.
The contractual maturities of substantially all available-for-sale
debt securities are due in less than one year at December 31, 2009.
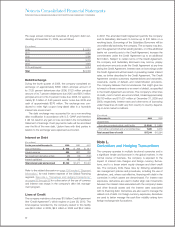
Note F.
Inventories
($ in millions)
At December 31: 2009 2008
Finished goods $ 533 $ 524
Work in process and raw materials 1,960 2,176
Total $2,494 $2,701
Note G.
Financing Receivables
($ in millions)
At December 31: 2009 2008
Current:
Net investment in sales-type and
direct financing leases $ 4,105 $ 4,226
Commercial financing receivables 5,604 5,781
Client loan receivables 4,475 4,861
Installment payment receivables 730 608
Total $14,914 $15,477
Noncurrent:
Net investment in sales-type and
direct financing leases $ 5,331 $ 5,938
Commercial financing receivables 58 94
Client loan receivables 4,759 4,718
Installment payment receivables 496 433
Total $10,644 $11,183
Net investment in sales-type and direct financing leases is for
leases that relate principally to the company’s systems products
and are for terms ranging generally from two to six years. Net
investment in sales-type and direct financing leases includes
unguaranteed residual values of $849 million and $916 million
at December 31, 2009 and 2008, respectively, and is reflected
net of unearned income of $905 million and $1,049 million and
of allowance for doubtful accounts receivable of $159 million
and $217 million at those dates, respectively. Scheduled maturi-
ties of minimum lease payments outstanding at December 31,
2009, expressed as a percentage of the total, are approximately:
2010, 49 percent; 2011, 27 percent; 2012, 15 percent; 2013, 6
percent; and 2014 and beyond, 2 percent.
Commercial financing receivables relate primarily to inventory
and accounts receivable financing for dealers and remarketers
of IBM and non-IBM products. Payment terms for inventory and
accounts receivable financing generally range from 30 to 90 days.
Client loan receivables are loans that are provided by Global
Financing primarily to clients to finance the purchase of soft-
ware and services. Separate contractual relationships on these
88