IBM 2009 Annual Report Download - page 59
Download and view the complete annual report
Please find page 59 of the 2009 IBM annual report below. You can navigate through the pages in the report by either clicking on the pages listed below, or by using the keyword search tool below to find specific information within the annual report.-
 1
1 -
2
-
3
-
4
-
5
-
6
-
7
-
8
-
9
-
10
-
11
-
12
-
13
-
14
-
15
-
16
-
17
-
18
-
19
-
20
-
21
-
22
-
23
-
24
-
25
-
26
-
27
-
28
-
29
-
30
-
31
-
32
-
33
-
34
-
35
-
36
-
37
-
38
-
39
-
40
-
41
-
42
-
43
-
44
-
45
-
46
-
47
-
48
-
 49
49 -
 50
50 -
 51
51 -
 52
52 -
 53
53 -
 54
54 -
 55
55 -
 56
56 -
 57
57 -
 58
58 -
 59
59 -
 60
60 -
 61
61 -
 62
62 -
 63
63 -
 64
64 -
 65
65 -
 66
66 -
 67
67 -
 68
68 -
 69
69 -
70
-
71
-
72
-
73
-
74
-
75
-
76
-
77
-
78
-
79
-
80
-
81
-
82
-
83
-
84
-
85
-
86
-
87
-
88
-
89
-
90
-
91
-
92
-
93
-
94
-
95
-
96
-
97
-
98
-
99
-
100
-
101
-
102
-
103
-
104
-
105
-
106
-
107
-
108
-
109
-
110
-
111
-
112
-
113
-
114
-
115
-
116
-
117
-
118
-
119
-
120
-
121
-
122
-
123
-
124
-
125
-
126
-
127
-
128
-
129
-
130
-
131
-
132
-
133
-
134
-
135
-
136
 |
 |

Global Financing
Global Financing is a reportable segment that is measured as if it
were a standalone entity. Accordingly, the information presented
in this section is consistent with this separate company view.
In 2009, as the global economy emerged from a challeng-
ing credit environment, the Global Financing business delivered
strong financial results. The Global Financing business remained
focused on its core competencies—providing IT financing to the
company’s clients and business partners. For the year, Global
Financing improved gross margin by 4.2 points and pre-tax
income margin by 6.1 points, while total revenue declined 8.4
percent. Total pre-tax income of $1,730 million increased 7.0
percent compared to 2008.
In addition to the overall health of the economy and its impact on
corporate IT budgets, key drivers of Global Financing’s results are
interest rates and originations. Interest rates directly impact Global
Financing’s business by increasing or decreasing both financing
revenue and the associated borrowing costs. Originations, which
determine the asset base of Global Financing’s annuity-like busi-
ness, are impacted by IBM’s non-Global Financing sales volumes
and Global Financing’s participation rates. Participation rates are
the propensity of IBM’s clients to finance their purchases through
Global Financing in lieu of paying IBM up-front cash or financing
through a third party.
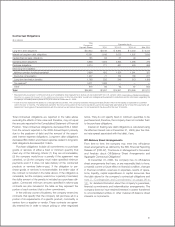
Results of Operations
($ in millions)
For the year ended December 31: 2009 2008 2007
External revenue $2,302 $2,559 $2,502
Internal revenue 1,774 1,892 1,482
Total revenue 4,076 4,451 3,984
Cost 1,555 1,887 1,819
Gross profit $2,520 $2,564 $2,165
Gross profit margin 61.8% 57.6% 54.4%
Pre-tax income $1,730 $1,617 $1,386
After-tax income* $1,138 $1,049 $ 877
Return on equity* 34.4% 29.4% 26.1%
* See page 61 for the details of the after-tax income and return on equity
calculation.
The decrease in 2009 revenue, as compared to 2008, was
primarily due to:
• A decline in external revenue of 10.0 percent (7 percent
adjusted for currency), due to decreases in financing revenue
(down 11.6 percent to $1,715 million) and in used equipment
sales (down 5.2 percent to $588 million); and
• A decline in internal revenue of 6.3 percent driven by a
decrease in financing revenue (down 22.0 percent to $580
million), partially offset by an increase in used equipment
sales (up 3.9 percent to $1,194 million).
The decrease in external and internal financing revenue was due
to lower average asset balances and lower asset yields.
Global Financing gross profit decreased 1.7 percent com-
pared to 2008 due to the lower revenue. Gross margin increased
4.2 points due to higher margins on financing and used equip-
ment sales.
The increase in 2008 revenue, as compared to 2007, was
primarily due to:
• An increase in external revenue of 2.3 percent (flat adjusted
for currency), due to growth in financing revenue (up 7.9 per-
cent to $1,939 million), partially offset by a decrease in used
equipment sales (down 12.0 percent to $620 million); and
• Growth in internal revenue of 27.7 percent primarily driven
by an increase in used equipment sales (up 47.2 percent to
$1,148 million) and an increase in financing revenue (up 6.0
percent to $744 million).
The increase in external and internal financing revenue was due
to higher average asset balances and higher asset yields.
Global Financing gross profit increased 18.4 percent in 2008
versus 2007, with gross margin increasing 3.3 points. This was
due to higher margins on financing and used equipment sales.
Global Financing pre-tax income increased 7.0 percent in
2009 versus 2008, following an increase of 16.7 percent in
2008 versus 2007. The increase in 2009 was primarily driven by
decreases in financing receivables provisions of $86 million and
other selling, general and administrative expenses of $67 million,
partially offset by the decrease in gross profit of $44 million. The
increase in 2008 was driven by the increase in gross profit of
$399 million, partially offset by an increase in financing receivables
provisions of $159 million. The decrease in financing receivables
provisions in 2009 was primarily due to lower specific reserve
requirements. Overall allowance for doubtful accounts coverage
rate is 2.1 percent, an increase of 0.1 points versus 2008.
The increase in return on equity from 2008 to 2009 was
driven by higher after-tax income and a lower average equity
balance, while the increase from 2007 to 2008 was primarily due
to higher after-tax income.
57