IBM 2009 Annual Report Download - page 66
Download and view the complete annual report
Please find page 66 of the 2009 IBM annual report below. You can navigate through the pages in the report by either clicking on the pages listed below, or by using the keyword search tool below to find specific information within the annual report.-
 1
1 -
2
-
3
-
4
-
5
-
6
-
7
-
8
-
9
-
10
-
11
-
12
-
13
-
14
-
15
-
16
-
17
-
18
-
19
-
20
-
21
-
22
-
23
-
24
-
25
-
26
-
27
-
28
-
29
-
30
-
31
-
32
-
33
-
34
-
35
-
36
-
37
-
38
-
39
-
40
-
41
-
42
-
43
-
44
-
45
-
46
-
47
-
48
-
49
-
50
-
51
-
52
-
53
-
54
-
55
-
 56
56 -
 57
57 -
 58
58 -
 59
59 -
 60
60 -
 61
61 -
 62
62 -
 63
63 -
 64
64 -
 65
65 -
 66
66 -
 67
67 -
 68
68 -
 69
69 -
 70
70 -
 71
71 -
 72
72 -
 73
73 -
 74
74 -
 75
75 -
 76
76 -
77
-
78
-
79
-
80
-
81
-
82
-
83
-
84
-
85
-
86
-
87
-
88
-
89
-
90
-
91
-
92
-
93
-
94
-
95
-
96
-
97
-
98
-
99
-
100
-
101
-
102
-
103
-
104
-
105
-
106
-
107
-
108
-
109
-
110
-
111
-
112
-
113
-
114
-
115
-
116
-
117
-
118
-
119
-
120
-
121
-
122
-
123
-
124
-
125
-
126
-
127
-
128
-
129
-
130
-
131
-
132
-
133
-
134
-
135
-
136
 |
 |

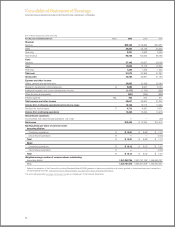
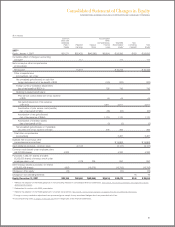
Consolidated Statement of Earnings
INTERNATIONAL BUSINESS MACHINES CORPORATION AND SUBSIDIARY COMPANIES
($ in millions except per share amounts)
For the year ended December 31: Notes 2009 2008 2007
Revenue:
Services $55,128 $ 58,892 $54,057
Sales 38,300 42,156 42,202
Financing 2,331 2,582 2,526
Total revenue 95,758 103,630 98,786
Cost:
Services 37,146 40,937 39,160
Sales 13,606 15,776 16,552
Financing 1,220 1,256 1,345
Total cost 51,973 57,969 57,057
Gross profit 43,785 45,661 41,729
Expense and other income:
Selling, general and administrative 20,952 23,386 22,060
Research, development and engineering Q 5,820 6,337 6,153
Intellectual property and custom development income (1,177) (1,153) (958)
Other (income) and expense (351) (298) (626)
Interest expense K&L 402 673 611
Total expense and other income 25,647 28,945 27,240
Income from continuing operations before income taxes 18,138 16,715 14,489
Provision for income taxes P 4,713 4,381 4,071
Income from continuing operations 13,425 12,334 10,418
Discontinued operations:
Income/(loss) from discontinued operations, net of tax — — (00)
Net income $13,425 $ 12,334 $10,418
Earnings/(loss) per share of common stock:
Assuming dilution:
Continuing operations R $ 10.01 $ 8.89* $ 7.15*
Discontinued operations R — — (0.00)
Total R $ 10.01 $ 8.89* $ 7.15*
Basic:
Continuing operations R $ 10.12 $ 9.02* $ 7.27*
Discontinued operations R — — (0.00)
Total R $ 10.12 $ 9.02* $ 7.27*
Weighted-average number of common shares outstanding:
Assuming dilution 1,341,352,754 1,387,797,198* 1,456,880,751*
Basic 1,327,157,410 1,369,367,069* 1,433,935,221*
* Reflects the adoption of the Financial Accounting Standards Board (FASB) guidance in determining whether instruments granted in share-based payment transactions
are participating securities. See note B, “Accounting Changes,” on pages 79 to 82 for additional information.
The accompanying notes on pages 70 through 126 are an integral part of the financial statements.
64