IBM 2009 Annual Report Download - page 28
Download and view the complete annual report
Please find page 28 of the 2009 IBM annual report below. You can navigate through the pages in the report by either clicking on the pages listed below, or by using the keyword search tool below to find specific information within the annual report.-
 1
1 -
2
-
3
-
4
-
5
-
6
-
7
-
8
-
9
-
10
-
11
-
12
-
13
-
14
-
15
-
16
-
17
-
 18
18 -
 19
19 -
 20
20 -
 21
21 -
 22
22 -
 23
23 -
 24
24 -
 25
25 -
 26
26 -
 27
27 -
 28
28 -
 29
29 -
 30
30 -
 31
31 -
 32
32 -
 33
33 -
 34
34 -
 35
35 -
 36
36 -
 37
37 -
 38
38 -
39
-
40
-
41
-
42
-
43
-
44
-
45
-
46
-
47
-
48
-
49
-
50
-
51
-
52
-
53
-
54
-
55
-
56
-
57
-
58
-
59
-
60
-
61
-
62
-
63
-
64
-
65
-
66
-
67
-
68
-
69
-
70
-
71
-
72
-
73
-
74
-
75
-
76
-
77
-
78
-
79
-
80
-
81
-
82
-
83
-
84
-
85
-
86
-
87
-
88
-
89
-
90
-
91
-
92
-
93
-
94
-
95
-
96
-
97
-
98
-
99
-
100
-
101
-
102
-
103
-
104
-
105
-
106
-
107
-
108
-
109
-
110
-
111
-
112
-
113
-
114
-
115
-
116
-
117
-
118
-
119
-
120
-
121
-
122
-
123
-
124
-
125
-
126
-
127
-
128
-
129
-
130
-
131
-
132
-
133
-
134
-
135
-
136
 |
 |

In 2009, Global Services and Software increased as a per-
centage of total segment revenue and total segment pre-tax
income, with Global Services and Software each contributing
42 percent of segment pre-tax income. These changes reflect
the company’s continuing transformation and the remix of its
business—both aimed at market segments that present the
best long-term opportunities.
Global Services
The Global Services segments, GTS and GBS, had combined
revenue of $55,000 million, a decrease of 6.6 percent (4 per-
cent adjusted for currency) in 2009 when compared to 2008.
Services revenue performance was supported by its annuity
revenue base, but also reflected the challenges in the more
economically sensitive consulting business.
Total Global Services signings of $57,094 million decreased 0.2
percent (increased 2 percent adjusted for currency). Outsourcing
signings of $33,014 million increased 8.8 percent (11 percent
adjusted for currency). Outsourcing signings growth was broad
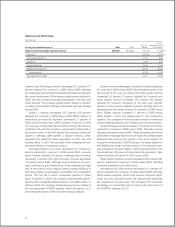
($ in millions)
Yr.-to-Yr.
Yr.-to-Yr. Change Adjusted
For the year ended December 31: 2009 2008 Change for Currency
Global Services external revenue: $55,000 $58,891 (6.6)% (4.0)%
Global Technology Services $37,347 $39,264 (4.9)% (2.0)%
Strategic Outsourcing 19,340 20,183 (4.2) (1.5)
Integrated Technology Services 8,771 9,283 (5.5) (2.9)
Business Transformation Outsourcing 2,280 2,550 (10.6) (6.1)
Maintenance 6,956 7,250 (4.1) (1.1)
Global Business Services $17,653 $19,628 (10.1)% (8.1)%
based across all the major geographies and in each business area:
Strategic Outsourcing, Business Transformation Outsourcing and
Application Outsourcing. Consulting and Systems Integration and
Integrated Technology Services signings were $24,081 million,
a decrease of 10.2 percent (8 percent adjusted for currency).
The estimated Global Services backlog at actual currency rates
was $137 billion at December 31, 2009, an increase of $7 billion
($1 billion adjusted for currency) from December 31, 2008 and
an increase of $2 billion ($3 billion adjusted for currency) from
September 30, 2009.
The Global Services segments delivered a combined pre-tax
profit of $8,092 million in 2009, a growth of 11.0 percent versus
2008, and expanded pre-tax margin 2.3 points to 14.1 percent.
The improved margin was a result of the structural changes made
to services delivery over the past several years. The services
global delivery capabilities have proven to be dynamic and flexible
enough to deal with very tough market conditions. Overall, the
Global Services business delivered strong margin and signings
performance in a difficult economic climate.
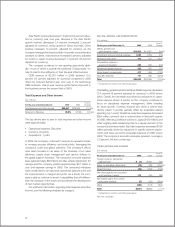
The following table presents each reportable segment’s external revenue as a percentage of total segment external revenue and each
reportable segment’s pre-tax income as a percentage of total segment pre-tax income.
Revenue Pre-tax Income*
For the year ended December 31: 2009 2008 2009 2008
Global Technology Services 39.4% 38.2% 28.6% 26.3%
Global Business Services 18.6 19.1 13.2 15.3
Total Global Services 58.0 57.3 41.9 41.6
Software 22.5 21.5 41.9 40.4
Systems and Technology 17.1 18.8 7.3 8.8
Global Financing 2.4 2.5 8.9 9.2
Total 100.0% 100.0% 100.0% 100.0%
* Segment pre-tax income includes transactions between segments that are intended to reflect an arm’s-length transfer price and excludes certain unallocated corporate
items; see note V, “Segment Information” for additional information.
26