IBM 2009 Annual Report Download - page 36
Download and view the complete annual report
Please find page 36 of the 2009 IBM annual report below. You can navigate through the pages in the report by either clicking on the pages listed below, or by using the keyword search tool below to find specific information within the annual report.-
 1
1 -
2
-
3
-
4
-
5
-
6
-
7
-
8
-
9
-
10
-
11
-
12
-
13
-
14
-
15
-
16
-
17
-
18
-
19
-
20
-
21
-
22
-
23
-
24
-
25
-
 26
26 -
 27
27 -
 28
28 -
 29
29 -
 30
30 -
 31
31 -
 32
32 -
 33
33 -
 34
34 -
 35
35 -
 36
36 -
 37
37 -
 38
38 -
 39
39 -
 40
40 -
 41
41 -
 42
42 -
 43
43 -
 44
44 -
 45
45 -
 46
46 -
47
-
48
-
49
-
50
-
51
-
52
-
53
-
54
-
55
-
56
-
57
-
58
-
59
-
60
-
61
-
62
-
63
-
64
-
65
-
66
-
67
-
68
-
69
-
70
-
71
-
72
-
73
-
74
-
75
-
76
-
77
-
78
-
79
-
80
-
81
-
82
-
83
-
84
-
85
-
86
-
87
-
88
-
89
-
90
-
91
-
92
-
93
-
94
-
95
-
96
-
97
-
98
-
99
-
100
-
101
-
102
-
103
-
104
-
105
-
106
-
107
-
108
-
109
-
110
-
111
-
112
-
113
-
114
-
115
-
116
-
117
-
118
-
119
-
120
-
121
-
122
-
123
-
124
-
125
-
126
-
127
-
128
-
129
-
130
-
131
-
132
-
133
-
134
-
135
-
136
 |
 |

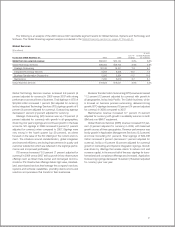
Overall retirement-related benefit costs decreased $24 million
versus 2008. Total plan costs decreased $142 millon year-to-
year, driven by lower defined contribution plans cost of $160
million compared to 2008. This decrease was offset by higher
costs for mandatory pension insolvency insurance coverage.
During the year ended December 31, 2009, the company paid
$140 million for mandatory pension insolvency insurance cover-
age in certain non-U.S. countries, an increase year to year of
$117 million driven primarily by premiums paid in Germany. While
not related to the IBM Plans, all companies with plans in Germany
and several other countries are subject to these charges.
Retirement-related plan costs decreased approximately $16
million in cost, $4 million in SG&A expense and $3 million in
RD&E expense.
See note U, “Retirement-Related Benefits,” on pages 109
through 121 for additional information on these plans and the
factors driving the year-to-year change in total cost.
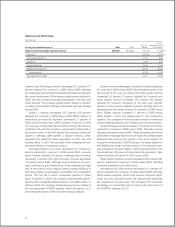
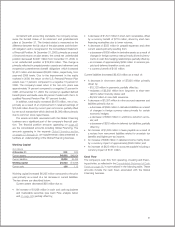
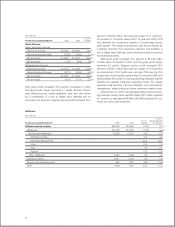
Acquired Intangible Asset Amortization
The company has been investing in targeted acquisitions to
increase its capabilities in higher value businesses. The following
table presents the total acquired intangible asset amortization
included in the Consol idated Statement of Earnings. See note
J, “Intangible Assets Including Goodwill,” on pages 89 and 90
for additional information.
($ in millions)
Yr.-to-Yr.
For the year ended December 31: 2009 2008 Change
Cost:
Software (Sales) $160 $173 (7.5)%
Global Technology Services (Services) 33 32 2.2
Systems and Technology (Sales) 11 8 27.0
Selling, general and
administrative expense 285 306 (6.9)
Total $489 $520 (6.0)%
Income Taxes
The effective tax rate for 2009 was 26.0 percent, compared
with 26.2 percent in 2008. The 0.2 point decrease was primarily
driven by a more favorable geographic mix of pre-tax income,
the absence of the 2008 tax cost impacts associated with the
intercompany transfer of certain intellectual property and the
agreements reached regarding the completion of the U.S. federal
income tax examination for the years 2004 and 2005, includ-
ing the associated income tax reserve redeterminations. These
benefits were offset by a decrease in 2009 in the utilization of
foreign tax credits.
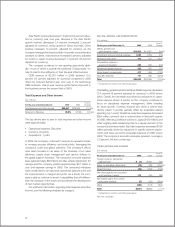
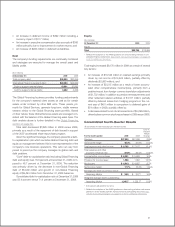
Earnings Per Share
Basic earnings per share is computed on the basis of the weighted-
average number of shares of common stock outstanding during
the period. Diluted earnings per share is computed on the basis
of the weighted-average number of shares of common stock
outstanding plus the effect of dilutive potential common shares
outstanding during the period using the treasury stock method.
Dilutive potential common shares include outstanding stock
options, share awards and convertible notes.
Yr.-to-Yr.
For the year ended December 31: 2009 2008 Change
Earnings per share of common stock:
Assuming dilution $10.01 $ 8.89* 12.6%
Basic $10.12 $ 9.02* 12.2%
Weighted-average shares
outstanding (in millions):
Assuming dilution 1,341.4 1,387.8* (3.3)%
Basic 1,327.2 1,369.4* (3.1)%
* Reflects the adoption of the FASB guidance in determining whether instruments
granted in share-based payment transactions are participating securities. See
note B, “Accounting Changes,” on pages 79 to 82 for additional information.
Actual shares outstanding at December 31, 2009 and December
31, 2008 were 1,305.3 million and 1,339.1 million, respectively.
The average number of common shares outstanding assuming
dilution was 46.4 million shares lower in 2009 versus 2008. The
decrease was primarily the result of the common stock repur-
chase program. See note N, “Equity Activity,” on pages 98 and
99 for additional information regarding common stock activities.
Also see note R, “Earnings Per Share of Common Stock,” on
page 104.
Financial Position
Dynamics
At December 31, 2009, the company’s balance sheet and liquidity
position remain strong. Cash on hand at year end was $12,183
million. Total debt of $26,099 million decreased $7,826 million
from prior year-end levels, primarily as a result of the repayment
of debt issued in support of the 2007 accelerated share repur-
chase program. The commercial paper balance at December
31, 2009 was $235 million, down $233 million from December
31, 2008. In 2009, the company generated $20,773 million in
cash from operations, an increase of $1,961 million compared
to 2008. The company has consistently generated strong cash
flow from operations and continues to have access to additional
sources of liquidity through the capital markets and its $10 billion
global credit facility.
34