IBM 2009 Annual Report Download - page 52
Download and view the complete annual report
Please find page 52 of the 2009 IBM annual report below. You can navigate through the pages in the report by either clicking on the pages listed below, or by using the keyword search tool below to find specific information within the annual report.-
 1
1 -
2
-
3
-
4
-
5
-
6
-
7
-
8
-
9
-
10
-
11
-
12
-
13
-
14
-
15
-
16
-
17
-
18
-
19
-
20
-
21
-
22
-
23
-
24
-
25
-
26
-
27
-
28
-
29
-
30
-
31
-
32
-
33
-
34
-
35
-
36
-
37
-
38
-
39
-
40
-
41
-
 42
42 -
 43
43 -
 44
44 -
 45
45 -
 46
46 -
 47
47 -
 48
48 -
 49
49 -
 50
50 -
 51
51 -
 52
52 -
 53
53 -
 54
54 -
 55
55 -
 56
56 -
 57
57 -
 58
58 -
 59
59 -
 60
60 -
 61
61 -
 62
62 -
63
-
64
-
65
-
66
-
67
-
68
-
69
-
70
-
71
-
72
-
73
-
74
-
75
-
76
-
77
-
78
-
79
-
80
-
81
-
82
-
83
-
84
-
85
-
86
-
87
-
88
-
89
-
90
-
91
-
92
-
93
-
94
-
95
-
96
-
97
-
98
-
99
-
100
-
101
-
102
-
103
-
104
-
105
-
106
-
107
-
108
-
109
-
110
-
111
-
112
-
113
-
114
-
115
-
116
-
117
-
118
-
119
-
120
-
121
-
122
-
123
-
124
-
125
-
126
-
127
-
128
-
129
-
130
-
131
-
132
-
133
-
134
-
135
-
136
 |
 |

Events that could temporarily change the historical cash flow
dynamics discussed above include significant changes in oper-
ating results, material changes in geographic sources of cash,
unexpected adverse impacts from litigation or future pension
funding requirements during periods of severe downturn in the
capital markets. Whether any litigation has such an adverse
impact will depend on a number of variables, which are more com-
pletely described in note O, “Contingencies and Commitments”
on pages 99 and 100. With respect to pension funding, in 2009,
the company contributed $1,252 million to its non-U.S. defined
benefit plans, versus $917 million in 2008. As highlighted in the
Contractual Obligations table on page 51, the company expects
to make legally mandated pension plan contributions to certain
non-U.S. plans of approximately $3.6 billion in the next five years.
The 2010 contributions are currently expected to be approxi-
mately $0.8 billion. Financial market performance in 2010 could
increase the legally mandated minimum contributions in certain
non-U.S. countries that require more frequent remeasurement
of the funded status. The company is not quantifying any fur-
ther impact from pension funding because it is not possible to
predict future movements in the capital markets or pension plan
funding regulations.
The Pension Protection Act of 2006 was enacted into law in
2006, and, among other things, increases the funding require-
ments for certain U.S. defined benefit plans beginning after
December 31, 2007. No mandatory contribution is required for
the U.S. defined benefit plan in 2010 as of December 31, 2009.
capital expenditures. As discussed on page 24, a key objective
of the Global Financing business is to generate strong returns on
equity. Increasing receivables is the basis for growth in a financing
business. Accordingly, management considers Global Financing
receivables as a profit-generating investment, not as working
capital that should be minimized for efficiency. After considering
Global Financing receivables as an investment, the remaining net
operational cash flow less net capital expenditures is viewed by
the company as free cash flow.
From the perspective of how management views cash flow, in
2009, free cash flow was $15.1 billion, an increase of $0.8 billion
compared to 2008. This cash performance was driven primarily
by the growth in net income of $1.1 billion, lower capital spending
of $0.8 billion and higher cash from sales cycle working capital
($1.2 billion), partially offset by higher retirement-related funding
($0.9 billion) and workforce rebalancing payments ($0.6 billion).
Over the past five years, the company generated over $61
billion in free cash flow. During that period, the company invested
$13.8 billion in strategic acquisitions and returned over $63 bil-
lion to shareholders through dividends and share repurchases.
The amount of prospective returns to shareholders in the form
of dividends and share repurchases will vary based upon several
factors including each year’s operating results, capital expendi-
ture requirements, research and development investments and
acquisitions, as well as the factors discussed below.
The company’s Board of Directors meets quarterly to consider
the dividend payment. The company expects to fund dividend
payments through cash from operations. In the second quarter
of 2009, the Board of Directors increased the company’s quar-
terly common stock dividend from $0.50 to $0.55 per share.
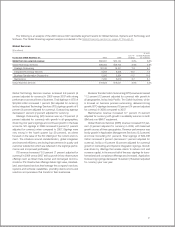
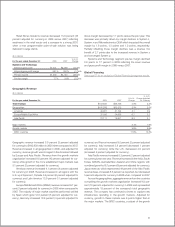
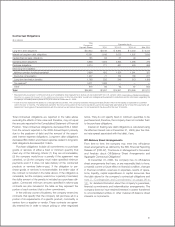
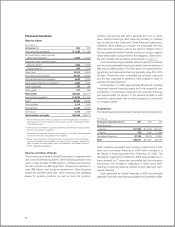
The table below represents the way in which management
reviews cash flow as described above.
($ in billions)
For the year ended December 31: 2009 2008 2007 2006 2005
Net cash from operating activities per GAAP (Continuing Operations) $20.8 $ 18.8 $16.1 $15.0 $14.9
Less: Global Financing receivables (1.9) (0.0) (1.3) (0.3) 1.8
Net cash from operating activities (Continuing Operations),
excluding Global Financing receivables 18.9 18.8 17.4 15.3 13.1
Capital expenditures, net (3.7) (4.5) (5.0) (4.7) (3.5)
Free cash flow (excluding Global Financing receivables) 15.1 14.3 12.4 10.5 9.6
Acquisitions (1.2) (6.3) (1.0) (3.8) (1.5)
Divestitures 0.4 0.1 0.3 — 0.9
Share repurchase (7.4) (10.6) (18.8) (8.1) (7.7)
Dividends (2.9) (2.6) (2.1) (1.7) (1.2)
Non-Global Financing debt (4.7) (3.2) 10.9 (1.1) 1.2
Other (includes Global Financing receivables
and Global Financing debt) 1.7 5.0 3.8 1.1 1.9
Change in cash, cash equivalents
and short-term marketable securities $ 1.1 $ (3.2) $ 5.5 $ (3.0) $ 3.1
50