IBM 2009 Annual Report Download - page 89
Download and view the complete annual report
Please find page 89 of the 2009 IBM annual report below. You can navigate through the pages in the report by either clicking on the pages listed below, or by using the keyword search tool below to find specific information within the annual report.-
 1
1 -
2
-
3
-
4
-
5
-
6
-
7
-
8
-
9
-
10
-
11
-
12
-
13
-
14
-
15
-
16
-
17
-
18
-
19
-
20
-
21
-
22
-
23
-
24
-
25
-
26
-
27
-
28
-
29
-
30
-
31
-
32
-
33
-
34
-
35
-
36
-
37
-
38
-
39
-
40
-
41
-
42
-
43
-
44
-
45
-
46
-
47
-
48
-
49
-
50
-
51
-
52
-
53
-
54
-
55
-
56
-
57
-
58
-
59
-
60
-
61
-
62
-
63
-
64
-
65
-
66
-
67
-
68
-
69
-
70
-
71
-
72
-
73
-
74
-
75
-
76
-
77
-
78
-
 79
79 -
 80
80 -
 81
81 -
 82
82 -
 83
83 -
 84
84 -
 85
85 -
 86
86 -
 87
87 -
 88
88 -
 89
89 -
 90
90 -
 91
91 -
 92
92 -
 93
93 -
 94
94 -
 95
95 -
 96
96 -
 97
97 -
 98
98 -
 99
99 -
100
-
101
-
102
-
103
-
104
-
105
-
106
-
107
-
108
-
109
-
110
-
111
-
112
-
113
-
114
-
115
-
116
-
117
-
118
-
119
-
120
-
121
-
122
-
123
-
124
-
125
-
126
-
127
-
128
-
129
-
130
-
131
-
132
-
133
-
134
-
135
-
136
 |
 |

Notes to Consolidated Financial Statements
INTERNATIONAL BUSINESS MACHINES CORPORATION AND SUBSIDIARY COMPANIES
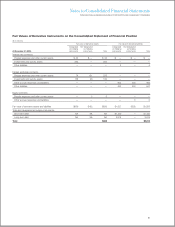
($ in millions)
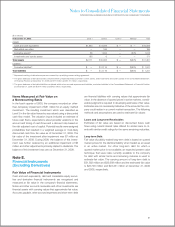
At December 31, 2008: Level 1 Level 2 Level 3 Netting(1) Total
Assets:
Cash and cash equivalents $1,950 $ 8,059 $ — $ — $10,009
Marketable securities — 166 — — 166
Derivative assets(2) 56 1,834 — (875) 1,015
Investments and sundry assets 165 6 — — 171
Total assets $2,171 $10,065 $ — $(875) $11,361
Liabilities:
Derivative liabilities(3) $ — $ 2,116 $ — $(875) $ 1,241
Total liabilities $ — $ 2,116 $ — $(875) $ 1,241
(1) Represents netting of derivative exposures covered by a qualifying master netting agreement.
(2)
The gross balances of derivative assets contained within prepaid expenses and other current assets, and investments and sundry assets in the Consolidated Statement
of Financial Position at December 31, 2008 are $773 million and $1,117 million, respectively.
(3) The gross balances of derivative liabilities contained within other accrued expenses and liabilities, and other liabilities in the Consolidated Statement of Financial Position
at December 31, 2008 are $1,414 million and $702 million, respectively.
Items Measured at Fair Value on
a Nonrecurring Basis
In the fourth quarter of 2008, the company recorded an other-
than-temporary impairment of $81 million for an equity method
investment. The resulting investment which was classified as
Level 3 in the fair value hierarchy was valued using a discounted
cash flow model. The valuation inputs included an estimate of
future cash flows, expectations about possible variations in the
amount and timing of cash flows and a discount rate based on
the risk-adjusted cost of capital. Potential results were assigned
probabilities that resulted in a weighted average or most-likely
discounted cash flow fair value as of December 31, 2008. The
fair value of the investment after impairment was $7 million at
December 31, 2008. During 2009, the balance of this invest-
ment was further reduced by an additional impairment of $5
million and other adjustments primarily related to dividends. The
balance of this investment was zero at December 31, 2009.
Note E.
Financial Instruments
(Excluding Derivatives)
Fair Value of Financial Instruments
Cash and cash equivalents, debt and marketable equity securi-
ties and derivative financial instruments are recognized and
measured at fair value in the company’s financial statements.
Notes and other accounts receivable and other investments are
financial assets with carrying values that approximate fair value.
Accounts payable, other accrued expenses and short-term debt
are financial liabilities with carrying values that approximate fair
value. In the absence of quoted prices in active markets, consid-
erable judgment is required in developing estimates of fair value.
Estimates are not necessarily indicative of the amounts the com-
pany could realize in a current market transaction. The following
methods and assumptions are used to estimate fair values:
Loans and Long-term Receivables
Estimates of fair value are based on discounted future cash
flows using current interest rates offered for similar loans to cli-
ents with similar credit ratings for the same remaining maturities.
Long-term Debt
Fair value of publicly traded long-term debt is based on quoted
market prices for the identical liability when traded as an asset
in an active market. For other long-term debt for which a
quoted market price is not available, an expected present value
technique that uses rates currently available to the company
for debt with similar terms and remaining maturies is used to
estimate fair value. The carrying amount of long-term debt is
$21,932 million and $22,689 million and the estimated fair value
is $23,748 million and $23,351 million at December 31, 2009
and 2008, respectively.
87