IBM 2009 Annual Report Download - page 14
Download and view the complete annual report
Please find page 14 of the 2009 IBM annual report below. You can navigate through the pages in the report by either clicking on the pages listed below, or by using the keyword search tool below to find specific information within the annual report.-
 1
1 -
2
-
3
-
 4
4 -
 5
5 -
 6
6 -
 7
7 -
 8
8 -
 9
9 -
 10
10 -
 11
11 -
 12
12 -
 13
13 -
 14
14 -
 15
15 -
 16
16 -
 17
17 -
 18
18 -
 19
19 -
 20
20 -
 21
21 -
 22
22 -
 23
23 -
 24
24 -
25
-
26
-
27
-
28
-
29
-
30
-
31
-
32
-
33
-
34
-
35
-
36
-
37
-
38
-
39
-
40
-
41
-
42
-
43
-
44
-
45
-
46
-
47
-
48
-
49
-
50
-
51
-
52
-
53
-
54
-
55
-
56
-
57
-
58
-
59
-
60
-
61
-
62
-
63
-
64
-
65
-
66
-
67
-
68
-
69
-
70
-
71
-
72
-
73
-
74
-
75
-
76
-
77
-
78
-
79
-
80
-
81
-
82
-
83
-
84
-
85
-
86
-
87
-
88
-
89
-
90
-
91
-
92
-
93
-
94
-
95
-
96
-
97
-
98
-
99
-
100
-
101
-
102
-
103
-
104
-
105
-
106
-
107
-
108
-
109
-
110
-
111
-
112
-
113
-
114
-
115
-
116
-
117
-
118
-
119
-
120
-
121
-
122
-
123
-
124
-
125
-
126
-
127
-
128
-
129
-
130
-
131
-
132
-
133
-
134
-
135
-
136
 |
 |
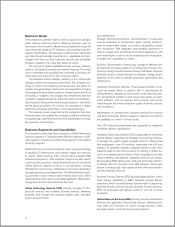
Pre-tax Income
Free Cash Flow
Revenue
Divested Revenue
Note: 2005
–
2008 EPS reects the adoption of amendments
to ASC 260, “Earnings Per Share”
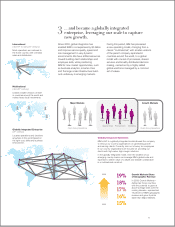
Financial Performance History
($ in billions)
Earnings Per Share
$
161
billion
As a result, IBM today is a
higher-performing enterprise.4
We have achieved record earnings per share …
Diluted earnings per share in 2009 were $10.01, marking
seven consecutive years of double-digit growth. Pre-tax
earnings from continuing operations were $18.1 billion, an
increase of 9 percent.
… and record cash performance.
In 2009 our free cash flow, excluding the year-to-year change
in Global Financing receivables, was $15.1 billion—an increase
of $800 million from 2008.
Our business model is more aligned with our clients’ needs and generates better financial results.
09080706050403020100
85 83 81
89
96
91 91
99
104
96
$18.1
$15.1
0
4
8
12
16
$20
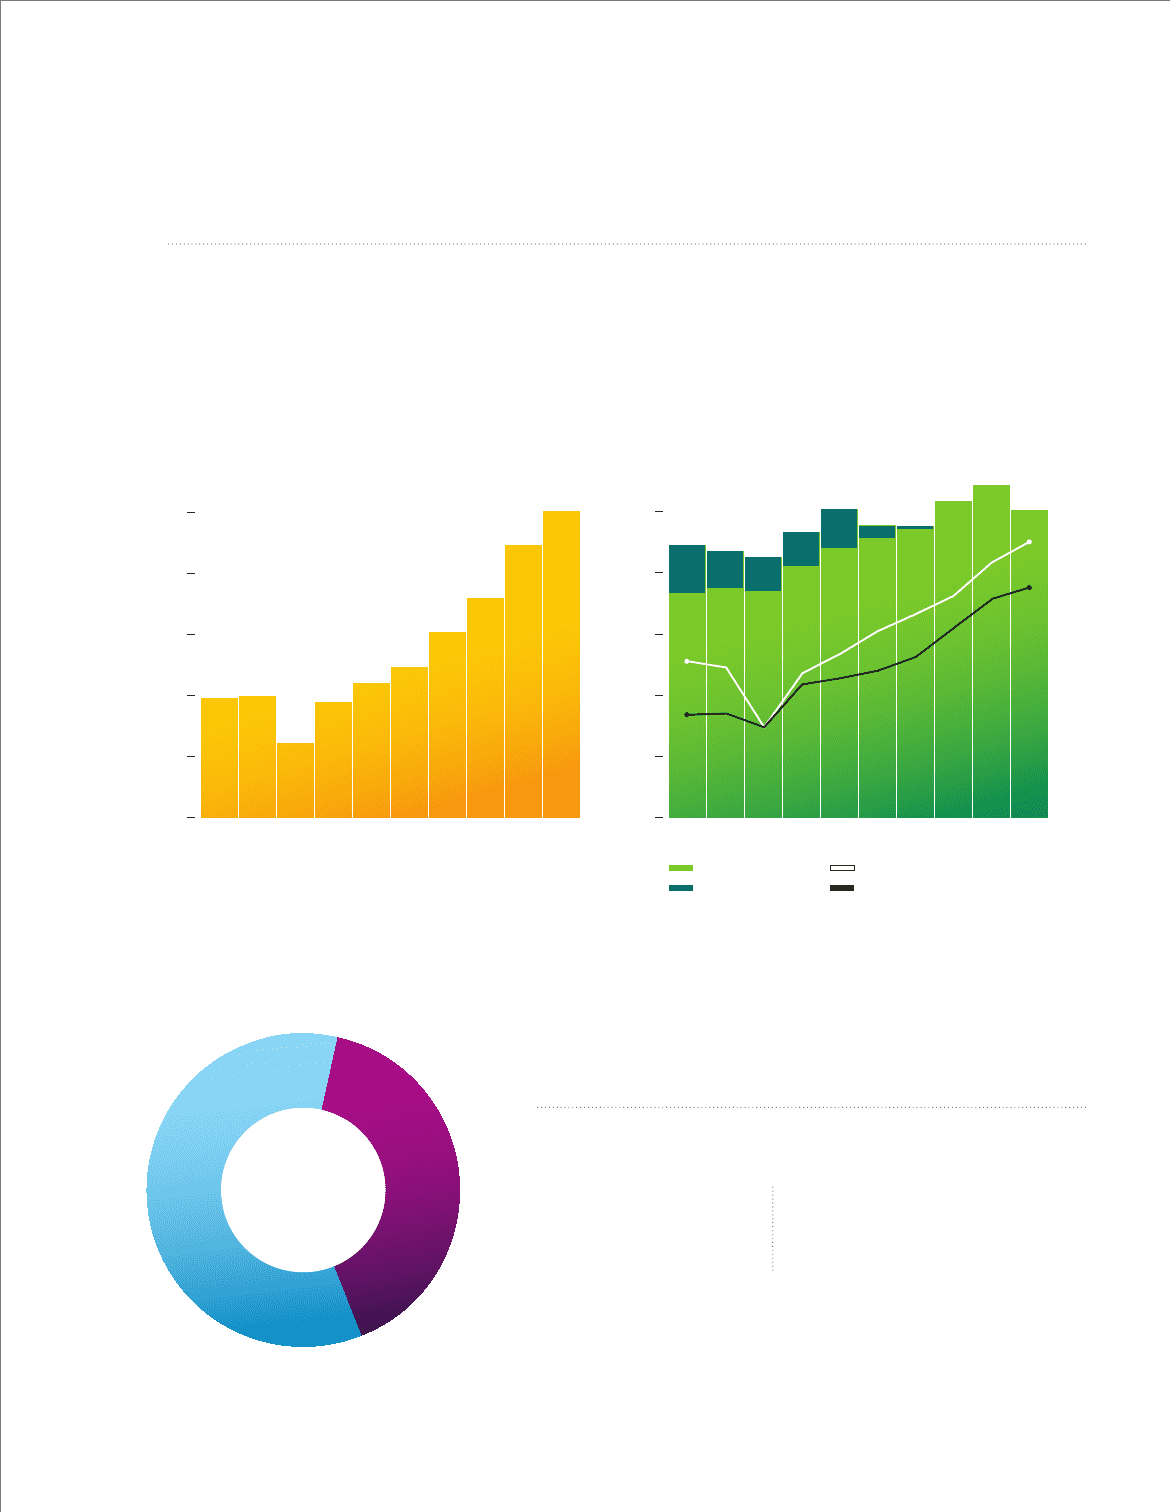
We have therefore been able to invest
in future sources of growth and provide
record return to shareholders . . .
Primary Uses of Cash
From 2000 to 2009
$65 billion
Reinvested
Acquisitions & Capital Expenditures
$96 billion
Returned to Shareholders
Share Repurchases & Dividends
. . . while continuing to invest in R&D—more
than $56 billion from 2000 to 2009.
5
3.88
2.43
09080706050403020100
3.94 3.76
4.39
4.91
6.05
7.15
8.89
10.01
0
2
4
6
8
$10
12