IBM 2009 Annual Report Download - page 30
Download and view the complete annual report
Please find page 30 of the 2009 IBM annual report below. You can navigate through the pages in the report by either clicking on the pages listed below, or by using the keyword search tool below to find specific information within the annual report.-
 1
1 -
2
-
3
-
4
-
5
-
6
-
7
-
8
-
9
-
10
-
11
-
12
-
13
-
14
-
15
-
16
-
17
-
18
-
19
-
 20
20 -
 21
21 -
 22
22 -
 23
23 -
 24
24 -
 25
25 -
 26
26 -
 27
27 -
 28
28 -
 29
29 -
 30
30 -
 31
31 -
 32
32 -
 33
33 -
 34
34 -
 35
35 -
 36
36 -
 37
37 -
 38
38 -
 39
39 -
 40
40 -
41
-
42
-
43
-
44
-
45
-
46
-
47
-
48
-
49
-
50
-
51
-
52
-
53
-
54
-
55
-
56
-
57
-
58
-
59
-
60
-
61
-
62
-
63
-
64
-
65
-
66
-
67
-
68
-
69
-
70
-
71
-
72
-
73
-
74
-
75
-
76
-
77
-
78
-
79
-
80
-
81
-
82
-
83
-
84
-
85
-
86
-
87
-
88
-
89
-
90
-
91
-
92
-
93
-
94
-
95
-
96
-
97
-
98
-
99
-
100
-
101
-
102
-
103
-
104
-
105
-
106
-
107
-
108
-
109
-
110
-
111
-
112
-
113
-
114
-
115
-
116
-
117
-
118
-
119
-
120
-
121
-
122
-
123
-
124
-
125
-
126
-
127
-
128
-
129
-
130
-
131
-
132
-
133
-
134
-
135
-
136
 |
 |

($ in millions)
Yr.-to-Yr.
Yr.-to-Yr. Change Adjusted
For the year ended December 31: 2009 2008 Change for Currency
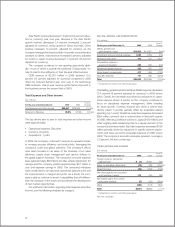
Global Technology Services Signings:
Outsourcing $25,507 $24,446 4.3% 8.1%
ITS 9,196 10,247 (10.3) (8.2)
Total $34,703 $34,693 0.0% 3.3%
Global Business Services Signings:
Application Outsourcing $ 7,506 $ 5,905 27.1% 25.1%
Consulting & Systems Integration 14,885 16,584 (10.2) (7.9)
Total $22,391 $22,488 (0.4)% 0.8%
Global Services signings are management’s initial estimate of the
revenue value of a client’s commitment under a Global Services
contract. Signings are used by management to assess period
performance of Global Services management. There are no third-
party standards or requirements governing the calculation of
signings. The calculation used by management involves estimates
and judgments to gauge the extent of a client’s commitment,
including the type and duration of the agreement, and the pres-
ence of termination charges or wind-down costs.
Signings include SO, BTO, ITS and GBS contracts. Contract
extensions and increases in scope are treated as signings only
to the extent of the incremental new revenue value. Maintenance
is not included in signings as maintenance contracts tend to be
more steady state, where revenues equal renewals.
Backlog includes SO, BTO, ITS, GBS and Maintenance.
Backlog is intended to be a statement of overall work under
contract and therefore does include Maintenance. Backlog esti-
mates are subject to change and are affected by several factors,
including terminations, changes in the scope of contracts, peri-
odic revalidations and adjustments for revenue not materialized.
Contract portfolios purchased in an acquisition are treated as
positive backlog adjustments provided those contracts meet the
company’s requirements for initial signings. A new signing will be
recognized if a new services agreement is signed incidental or
coincidental to an acquisition or divestiture.
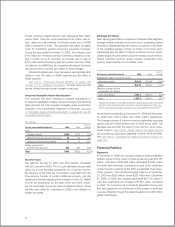
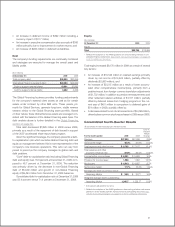
Software
($ in millions)
Yr.-to-Yr.
Yr.-to-Yr. Change Adjusted
For the year ended December 31: 2009 2008* Change for Currency
Software external revenue: $21,396 $22,089 (3.1)% (0.8)%
Middleware $17,125 $17,305 (1.0)% 1.4%
Key Branded Middleware 12,524 12,392 1.1 3.4
WebSphere Family 10.5 12.7
Information Management (0.5) 1.9
Lotus (10.0) (7.9)
Tivoli 2.9 5.1
Rational 0.2 2.7
Other middleware 4,602 4,912 (6.3) (3.5)
Operating systems 2,163 2,337 (7.4) (4.9)
Product Lifecycle Management 739 960 (23.0) (21.7)
Other 1,369 1,488 (8.0) (5.8)
* Reclassified to conform with 2009 presentation.
28