IBM 2009 Annual Report Download - page 119
Download and view the complete annual report
Please find page 119 of the 2009 IBM annual report below. You can navigate through the pages in the report by either clicking on the pages listed below, or by using the keyword search tool below to find specific information within the annual report.-
 1
1 -
2
-
3
-
4
-
5
-
6
-
7
-
8
-
9
-
10
-
11
-
12
-
13
-
14
-
15
-
16
-
17
-
18
-
19
-
20
-
21
-
22
-
23
-
24
-
25
-
26
-
27
-
28
-
29
-
30
-
31
-
32
-
33
-
34
-
35
-
36
-
37
-
38
-
39
-
40
-
41
-
42
-
43
-
44
-
45
-
46
-
47
-
48
-
49
-
50
-
51
-
52
-
53
-
54
-
55
-
56
-
57
-
58
-
59
-
60
-
61
-
62
-
63
-
64
-
65
-
66
-
67
-
68
-
69
-
70
-
71
-
72
-
73
-
74
-
75
-
76
-
77
-
78
-
79
-
80
-
81
-
82
-
83
-
84
-
85
-
86
-
87
-
88
-
89
-
90
-
91
-
92
-
93
-
94
-
95
-
96
-
97
-
98
-
99
-
100
-
101
-
102
-
103
-
104
-
105
-
106
-
107
-
108
-
 109
109 -
 110
110 -
 111
111 -
 112
112 -
 113
113 -
 114
114 -
 115
115 -
 116
116 -
 117
117 -
 118
118 -
 119
119 -
 120
120 -
 121
121 -
 122
122 -
 123
123 -
 124
124 -
 125
125 -
 126
126 -
 127
127 -
 128
128 -
 129
129 -
130
-
131
-
132
-
133
-
134
-
135
-
136
 |
 |

Notes to Consolidated Financial Statements
INTERNATIONAL BUSINESS MACHINES CORPORATION AND SUBSIDIARY COMPANIES
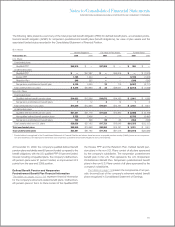
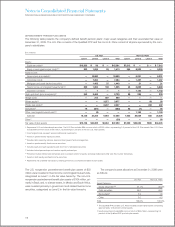
HEALTHCARE COST TREND RATE
For nonpension postretirement benefit plan accounting, the
company reviews external data and its own historical trends for
healthcare costs to determine the healthcare cost trend rates.
However, the healthcare cost trend rate has an insignificant
effect on plan costs and obligations as a result of the terms of
the plan which limit the company’s obligation to the participants.
The company assumes that the healthcare cost trend rate for
2010 will be 7 percent. In addition, the company assumes that
the same trend rate will decrease to 5 percent over the next
three years. A one percentage point increase or decrease in the
assumed healthcare cost trend rate would not have a material
effect on 2009, 2008 and 2007 net periodic cost or the benefit
obligations as of December 31, 2009 and 2008.
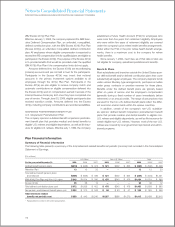
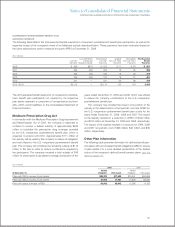
Plan Assets
Retirement-related benefit plan assets are recognized and mea-
sured at fair value as described in note A, “Significant Accounting
Policies,” on page 77. Because of the inherent uncertainty of
valuations, these fair value measurements may not necessarily
reflect the amounts the company could realize in current market
transactions.
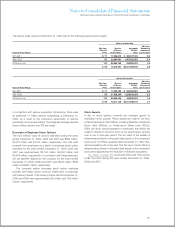
INVESTMENT POLICIES AND STRATEGIES
The investment objectives of the Qualified PPP portfolio are
designed to generate returns that will enable the plan to meet
its future obligations. The precise amount for which these obli-
gations will be settled depends on future events, including the
retirement dates and life expectancy of the plans’ participants.
The obligations are estimated using actuarial assumptions, based
on the current economic environment and other pertinent factors
described on page 115. The Qualified PPP portfolio’s investment
strategy balances the requirement to generate returns, using
potentially higher yielding assets such as equity securities, with
the need to control risk in the portfolio with less volatile assets,
such as fixed-income securities. Risks include, among others,
inflation, volatility in equity values and changes in interest rates
that could cause the plan to become underfunded, thereby
increasing its dependence on contributions from the company.
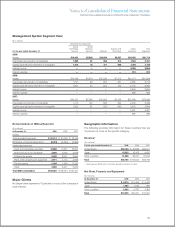
To mitigate any potential concentration risk, careful consider-
ation is given to balancing the portfolio among industry sectors,
companies and geographies, taking into account interest rate
sensitivity, dependence on economic growth, currency and other
factors that affect investment returns. As a result, the Qualified
PPP portfolio’s target allocation is 44 percent equity securities,
46 percent fixed income securities, 5 percent real estate and 5
percent other investments, which is consistent with the alloca-
tion decisions made by the company’s management and is
similar to the prior year target allocation. The table on page 118
details the actual allocation of equity, fixed income, real estate
and all other types of investments for the Qualified PPP portfolio.
The assets are managed by professional investment firms
and investment professionals who are employees of the com-
pany. They are bound by investment mandates determined by
the company’s management and are measured against specific
benchmarks. Among these managers, consideration is given,
but not limited to, balancing security concentration, issuer con-
centration, investment style and reliance on particular active and
passive investment strategies.
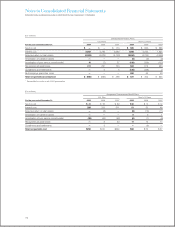
Market liquidity risks are tightly controlled, with only a mod-
est percentage of the Qualified PPP portfolio invested in private
market assets consisting of private equities and private real
estate investments, which are less liquid than publicly traded
securities. As of December 31, 2009, the Qualified PPP port-
folio had $3,618 million in commitments for future investments
in private markets to be made over a number of years. These
commitments are expected to be funded from plan assets.
Derivatives are used on a limited basis as an effective means
to achieve investment objectives and/or as a component of
the plan’s risk management strategy. The primary reasons for
the use of derivatives are fixed income management, including
duration, interest rate management and credit exposure, cash
equitization and as a means to gain exposure to the currency
and commodities markets.
Outside the U.S., the investment objectives are similar to
those described above, subject to local regulations. The weighted-
average target allocation for the non-U.S. plans is 47 percent
equity securities, 46 percent fixed income securities, 2 percent
real estate and 5 percent other investments, which is consistent
with the allocation decisions made by the company’s manage-
ment and is similar to the prior year weighted-average target
allocation. The table on page 118 details the actual allocations
of equity, fixed income, real estate and all other types of invest-
ments for non-U.S. plans. In some countries, a higher percent-
age allocation to fixed income securities is required. In others,
the responsibility for managing the investments typically lies with
a board that may include up to 50 percent of members elected
by employees and retirees. This can result in slight differences
compared with the strategies previously described. Generally,
these non-U.S. plans do not invest in illiquid assets and their
use of derivatives is usually limited to currency hedging, adjust-
ing portfolio durations and reducing specific market risks. There
was no significant change in the investment strategies of these
plans during either 2009 or 2008.
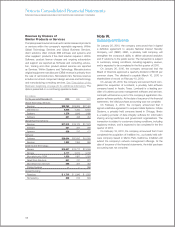
The company’s nonpension postretirement benefit plans are
underfunded or unfunded. For some plans, the company main-
tains a nominal, highly liquid trust fund balance to ensure timely
benefit payments.
117