IBM 2009 Annual Report Download - page 60
Download and view the complete annual report
Please find page 60 of the 2009 IBM annual report below. You can navigate through the pages in the report by either clicking on the pages listed below, or by using the keyword search tool below to find specific information within the annual report.-
 1
1 -
2
-
3
-
4
-
5
-
6
-
7
-
8
-
9
-
10
-
11
-
12
-
13
-
14
-
15
-
16
-
17
-
18
-
19
-
20
-
21
-
22
-
23
-
24
-
25
-
26
-
27
-
28
-
29
-
30
-
31
-
32
-
33
-
34
-
35
-
36
-
37
-
38
-
39
-
40
-
41
-
42
-
43
-
44
-
45
-
46
-
47
-
48
-
49
-
 50
50 -
 51
51 -
 52
52 -
 53
53 -
 54
54 -
 55
55 -
 56
56 -
 57
57 -
 58
58 -
 59
59 -
 60
60 -
 61
61 -
 62
62 -
 63
63 -
 64
64 -
 65
65 -
 66
66 -
 67
67 -
 68
68 -
 69
69 -
 70
70 -
71
-
72
-
73
-
74
-
75
-
76
-
77
-
78
-
79
-
80
-
81
-
82
-
83
-
84
-
85
-
86
-
87
-
88
-
89
-
90
-
91
-
92
-
93
-
94
-
95
-
96
-
97
-
98
-
99
-
100
-
101
-
102
-
103
-
104
-
105
-
106
-
107
-
108
-
109
-
110
-
111
-
112
-
113
-
114
-
115
-
116
-
117
-
118
-
119
-
120
-
121
-
122
-
123
-
124
-
125
-
126
-
127
-
128
-
129
-
130
-
131
-
132
-
133
-
134
-
135
-
136
 |
 |

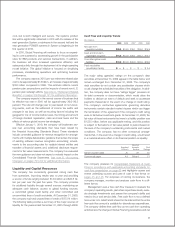
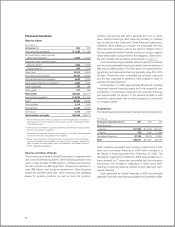
Financial Condition
Balance Sheet
($ in millions)
At December 31: 2009 2008
Cash and cash equivalents $ 1,285 $ 1,269
Net investment in sales-type and
direct financing leases 9,482 10,203
Equipment under operating leases:
External clients(a) 1,863 2,139
Internal clients(b)(c) 994 1,709
Client loans 10,413 10,615
Total client financing assets 22,752 24,667
Commercial financing receivables 5,662 5,875
Intercompany financing receivables(b)(c) 3,660 2,957
Other receivables 370 396
Other assets 877 956
Total assets $34,605 $36,119
Intercompany payables(b) $ 5,879 $ 5,391
Debt(d) 22,383 24,360
Other liabilities 3,174 2,875
Total liabilities 31,435 32,626
Total equity 3,170 3,493
Total liabilities and equity $34,605 $36,119
(a) Includes intercompany mark-up, priced on an arms-length basis, on products
purchased from the company’s product divisions, which is eliminated in IBM’s
consolidated results.
(b) Entire amount eliminated for purposes of IBM’s consolidated results and there-
fore does not appear on page 65.
(c) These assets, along with all other financing assets in this table, are leveraged at
the value in the table using Global Financing debt.
(d) Global Financing debt is comprised of intercompany loans and external debt.
A portion of Global Financing debt is in support of the company’s internal busi-
ness, or related to intercompany mark-up embedded in the Global Financing
assets. See table on page 60.
Sources and Uses of Funds
The primary use of funds in Global Financing is to originate client
and commercial financing assets. Client financing assets for end
users consist primarily of IBM systems, software and services,
but also include non-IBM equipment, software and services to
meet IBM clients’ total solutions requirements. Client financing
assets are primarily sales-type, direct financing and operating
leases for systems products, as well as loans for systems,
software and services with terms generally from two to seven
years. Global Financing’s client loans are primarily for software
and services and are unsecured. These loans are subjected to
additional credit analysis to evaluate the associated risk and,
when deemed necessary, actions are taken to mitigate risks in
the loan agreements which include covenants to protect against
credit deterioration during the life of the obligation. Client financ-
ing also includes internal activity as described on page 24.
Commercial financing receivables arise primarily from inventory
and accounts receivable financing for dealers and remarketers of
IBM and non-IBM products. Payment terms for inventory financ-
ing and accounts receivable financing generally range from 30 to
90 days. These short-term receivables are primarily unsecured
and are also subjected to additional credit analysis in order to
evaluate the associated risk.
At December 31, 2009, approximately 98 percent of Global
Financing’s external financing assets are in the segment’s core
competency of technology equipment and solutions financing,
and approximately 59 percent of the external portfolio is with
investment grade clients with no direct exposure to consumers
or mortgage assets.
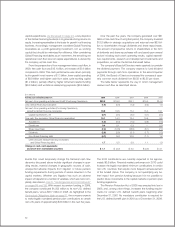
Originations
The following are total external and internal financing originations.
($ in millions)
For the year ended December 31: 2009 2008 2007
Client financing:
External $11,760 $14,790 $14,171
Internal 755 1,039 1,040
Commercial financing 27,126 32,078 30,541
Total $39,641 $47,907 $45,752
Cash collections exceeded new financing originations for both
client and commercial financing in 2009 which resulted in a
net decline in financing assets from December 31, 2008. The
decrease in originations in 2009 from 2008 was primarily due to
lower demand for IT equipment associated with the economic
environment. The increase in originations in 2008 versus 2007
was due to improving external volumes in both client and com-
mercial financing.
Cash generated by Global Financing in 2009 was primarily
deployed to pay the intercompany payables and dividends to IBM.
58