IBM 2009 Annual Report Download - page 44
Download and view the complete annual report
Please find page 44 of the 2009 IBM annual report below. You can navigate through the pages in the report by either clicking on the pages listed below, or by using the keyword search tool below to find specific information within the annual report.-
 1
1 -
2
-
3
-
4
-
5
-
6
-
7
-
8
-
9
-
10
-
11
-
12
-
13
-
14
-
15
-
16
-
17
-
18
-
19
-
20
-
21
-
22
-
23
-
24
-
25
-
26
-
27
-
28
-
29
-
30
-
31
-
32
-
33
-
 34
34 -
 35
35 -
 36
36 -
 37
37 -
 38
38 -
 39
39 -
 40
40 -
 41
41 -
 42
42 -
 43
43 -
 44
44 -
 45
45 -
 46
46 -
 47
47 -
 48
48 -
 49
49 -
 50
50 -
 51
51 -
 52
52 -
 53
53 -
 54
54 -
55
-
56
-
57
-
58
-
59
-
60
-
61
-
62
-
63
-
64
-
65
-
66
-
67
-
68
-
69
-
70
-
71
-
72
-
73
-
74
-
75
-
76
-
77
-
78
-
79
-
80
-
81
-
82
-
83
-
84
-
85
-
86
-
87
-
88
-
89
-
90
-
91
-
92
-
93
-
94
-
95
-
96
-
97
-
98
-
99
-
100
-
101
-
102
-
103
-
104
-
105
-
106
-
107
-
108
-
109
-
110
-
111
-
112
-
113
-
114
-
115
-
116
-
117
-
118
-
119
-
120
-
121
-
122
-
123
-
124
-
125
-
126
-
127
-
128
-
129
-
130
-
131
-
132
-
133
-
134
-
135
-
136
 |
 |

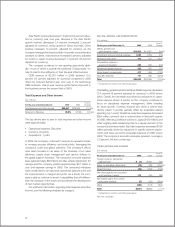
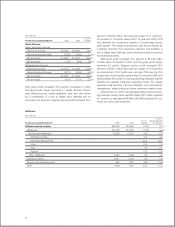
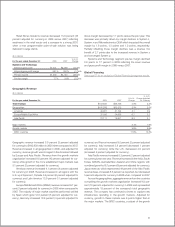
($ in millions)
Yr.-to-Yr.
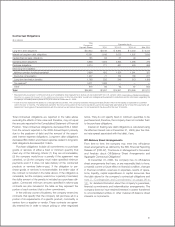
For the year ended December 31: 2008 2007 Change
Global Services:
Global Technology Services:
External gross profit $12,802 $10,800 18.5%
External gross profit margin 32.6% 29.9% 2.7 pts.
Pre-tax income $ 4,607 $ 3,557 29.5%
Pre-tax margin 11.3% 9.4% 1.9 pts.
Global Business Services:
External gross profit $ 5,238 $ 4,240 23.5%
External gross profit margin 26.7% 23.5% 3.2 pts.
Pre-tax income $ 2,681 $ 2,064 29.9%
Pre-tax margin 13.0% 10.7% 2.2 pts.
GTS gross profit increased 18.5 percent compared to 2007,
with gross profit margin improving 2.7 points. All lines of busi-
ness delivered gross margin expansion year over year driven
by a combination of a mix to higher value offerings and an
improved cost structure. Segment pre-tax profit increased 29.5
percent to $4,607 million with a pre-tax margin of 11.3 percent,
an increase of 1.9 points versus 2007. At year-end 2008, GTS
had delivered six consecutive quarters of double-digit pre-tax
profit growth. The margin improvement was driven primarily by
a delivery structure that maximizes utilization and flexibility, a
mix to higher value offerings, lower retirement-related costs and
improved productivity.
GBS gross profit increased 23.5 percent to $5,238 million
in 2008 when compared to 2007, and the gross profit margin
improved 3.2 points. Segment pre-tax profit increased 29.9
percent to $2,681 million with a pre-tax margin of 13.0 percent,
an improvement of 2.2 points year over year. This was the third
straight year of profit growth greater than 20 percent in GBS and
demonstrates the results of a strong operating discipline and the
benefits of a globally integrated operating model. The margin
expansion was driven by improved utilization, cost and expense
management, stable pricing and lower retirement-related costs.
At December 31, 2008, the estimated Global Services back-
log at actual currency rates was $130 billion ($117 billion adjusted
for currency), a decrease of $6 billion ($2 billion adjusted for cur-
rency) from prior year-end levels.
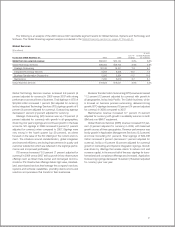
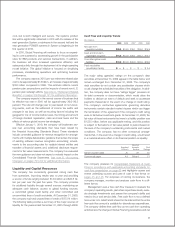
Software
($ in millions)
Yr.-to-Yr.
Yr.-to-Yr. Change Adjusted
For the year ended December 31: 2008 2007 Change for Currency
Software external revenue: $22,089 $19,982 10.5% 8.1%
Middleware $17,305 $15,505 11.6% 9.5%
Key Branded Middleware 12,383 10,827 14.4 12.5
WebSphere Family 6.2 4.5
Information Management 24.5 22.0
Lotus 10.4 7.8
Tivoli 2.9 2.1
Rational 13.2 11.6
Other middleware 4,922 4,678 5.2 2.6
Operating systems 2,337 2,319 0.8 (1.9)
Product Lifecycle Management 960 1,051 (8.6) (14.4)
Other 1,488 1,107 34.4 31.3
42