IBM 2009 Annual Report Download - page 43
Download and view the complete annual report
Please find page 43 of the 2009 IBM annual report below. You can navigate through the pages in the report by either clicking on the pages listed below, or by using the keyword search tool below to find specific information within the annual report.-
 1
1 -
2
-
3
-
4
-
5
-
6
-
7
-
8
-
9
-
10
-
11
-
12
-
13
-
14
-
15
-
16
-
17
-
18
-
19
-
20
-
21
-
22
-
23
-
24
-
25
-
26
-
27
-
28
-
29
-
30
-
31
-
32
-
 33
33 -
 34
34 -
 35
35 -
 36
36 -
 37
37 -
 38
38 -
 39
39 -
 40
40 -
 41
41 -
 42
42 -
 43
43 -
 44
44 -
 45
45 -
 46
46 -
 47
47 -
 48
48 -
 49
49 -
 50
50 -
 51
51 -
 52
52 -
 53
53 -
54
-
55
-
56
-
57
-
58
-
59
-
60
-
61
-
62
-
63
-
64
-
65
-
66
-
67
-
68
-
69
-
70
-
71
-
72
-
73
-
74
-
75
-
76
-
77
-
78
-
79
-
80
-
81
-
82
-
83
-
84
-
85
-
86
-
87
-
88
-
89
-
90
-
91
-
92
-
93
-
94
-
95
-
96
-
97
-
98
-
99
-
100
-
101
-
102
-
103
-
104
-
105
-
106
-
107
-
108
-
109
-
110
-
111
-
112
-
113
-
114
-
115
-
116
-
117
-
118
-
119
-
120
-
121
-
122
-
123
-
124
-
125
-
126
-
127
-
128
-
129
-
130
-
131
-
132
-
133
-
134
-
135
-
136
 |
 |

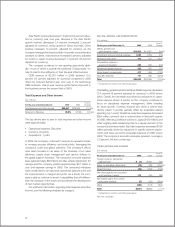
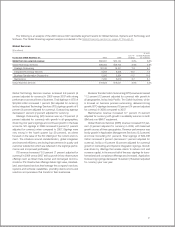
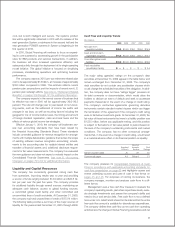
The following is an analysis of the 2008 versus 2007 reportable segment results for Global Services, Systems and Technology and
Software. The Global Financing segment analysis is included in the Global Financing section on pages 57 through 61.
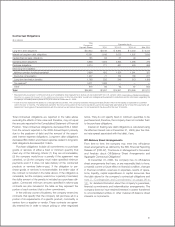
Global Services
($ in millions)
Yr.-to-Yr.
Yr.-to-Yr. Change Adjusted
For the year ended December 31: 2008 2007 Change for Currency
Global Services external revenue: $58,891 $54,144 8.8% 5.6%
Global Technology Services: $39,264 $36,103 8.8% 5.8%
Strategic Outsourcing 20,183 18,701 7.9 4.7
Integrated Technology Services 9,283 8,438 10.0 7.5
Business Transformation Outsourcing 2,550 2,294 11.2 11.9
Maintenance 7,250 6,670 8.7 5.1
Global Business Services $19,628 $18,041 8.8% 5.2%
Global Technology Services revenue increased 8.8 percent (6
percent adjusted for currency) in 2008 versus 2007 with strong
performance across all lines of business. Total signings in GTS of
$34,693 million increased 1 percent (flat adjusted for currency)
led by Integrated Technology Services (ITS) signings growth of 5
percent (4 percent adjusted for currency). Outsourcing signings
decreased 1 percent (2 percent adjusted for currency).
Strategic Outsourcing (SO) revenue was up 7.9 percent (5
percent adjusted for currency) with growth in all geographies,
driven by prior year’s signings and continued growth in the base
accounts. SO signings in 2008 increased 3 percent (1 percent
adjusted for currency) when compared to 2007. Signings were
very strong in the fourth quarter (up 20 percent), as clients
focused on the value of the SO offerings in the current environ-
ment. The initiatives around standardization, global integration
and improved efficiency are driving improvements in quality and
customer satisfaction which are reflected in the signings perfor-
mance and in improved profitability.
ITS revenue increased 10.0 percent (7 percent adjusted for
cur rency) in 2008 versus 2007 led by growth in key infrastructure
offerings such as Green Data Cen ter and Converged Commu-
nications. ITS infrastructure offerings deliver high-value, standard-
ized, asset-based services that leverage the company’s services,
systems and software capabilities, providing clients end-to-end
solutions and processes that transform their businesses.
Business Transformation Outsourcing (BTO) revenue increased
11.2 percent (12 percent adjusted for currency) with growth in
all geographies, led by Asia Pacific. The Daksh business, which
is focused on business process outsourcing, delivered strong
growth. BTO signings decreased 18 percent (14 percent adjusted
for currency) in 2008 compared to 2007.
Maintenance revenue increased 8.7 percent (5 percent
adjusted for currency) with growth in availability services on both
IBM and non-IBM IT equipment.
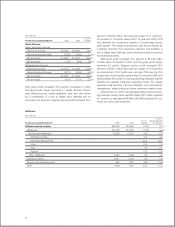
Global Business Services (GBS) revenue increased 8.8 per-
cent (5 percent adjusted for currency) in 2008, with balanced
growth across all three geographies. Revenue performance was
led by growth in Application Management Services (12.5 percent)
and Core Consulting (6.1 percent). Total signings of $22,488
million increased 2 percent (decreased 1 percent adjusted for
currency), led by a 10 percent (6 percent adjusted for currency)
growth in Consulting and Systems Integration signings. Growth
was driven by offerings that enable clients to reduce cost and
conserve capital. In the second half of the year, signings for trans-
formational and compliance offerings also increased. Application
Outsourcing signings decreased 14 percent (16 percent adjusted
for currency) year over year.
41