IBM 2009 Annual Report Download - page 114
Download and view the complete annual report
Please find page 114 of the 2009 IBM annual report below. You can navigate through the pages in the report by either clicking on the pages listed below, or by using the keyword search tool below to find specific information within the annual report.-
 1
1 -
2
-
3
-
4
-
5
-
6
-
7
-
8
-
9
-
10
-
11
-
12
-
13
-
14
-
15
-
16
-
17
-
18
-
19
-
20
-
21
-
22
-
23
-
24
-
25
-
26
-
27
-
28
-
29
-
30
-
31
-
32
-
33
-
34
-
35
-
36
-
37
-
38
-
39
-
40
-
41
-
42
-
43
-
44
-
45
-
46
-
47
-
48
-
49
-
50
-
51
-
52
-
53
-
54
-
55
-
56
-
57
-
58
-
59
-
60
-
61
-
62
-
63
-
64
-
65
-
66
-
67
-
68
-
69
-
70
-
71
-
72
-
73
-
74
-
75
-
76
-
77
-
78
-
79
-
80
-
81
-
82
-
83
-
84
-
85
-
86
-
87
-
88
-
89
-
90
-
91
-
92
-
93
-
94
-
95
-
96
-
97
-
98
-
99
-
100
-
101
-
102
-
103
-
 104
104 -
 105
105 -
 106
106 -
 107
107 -
 108
108 -
 109
109 -
 110
110 -
 111
111 -
 112
112 -
 113
113 -
 114
114 -
 115
115 -
 116
116 -
 117
117 -
 118
118 -
 119
119 -
 120
120 -
 121
121 -
 122
122 -
 123
123 -
 124
124 -
125
-
126
-
127
-
128
-
129
-
130
-
131
-
132
-
133
-
134
-
135
-
136
 |
 |

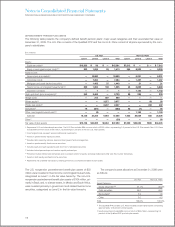
Notes to Consolidated Financial Statements
INTERNATIONAL BUSINESS MACHINES CORPORATION AND SUBSIDIARY COMPANIES
($ in millions)
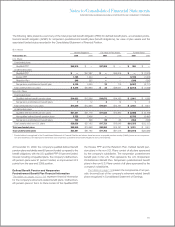
Defined Benefit Pension Plans
U.S. Plans Non-U.S. Plans
For the year ended December 31: 2009 2008 2007 2009 2008* 2007*
Service cost $ — $ — $ 773 $ 585 $ 660 $ 688
Interest cost 2,682 2,756 2,660 1,898 2,042 1,825
Expected return on plan assets (4,009) (3,978) (3,703) (2,534) (2,725) (2,528)
Amortization of transition assets — — — (0) (0) (3)
Amortization of prior service costs/(credits) 10 (7) 57 (126) (129) (125)
Recognized actuarial losses 411 291 703 624 612 934
Curtailments and settlements — 2 5 (126) (139) 2
Multi-employer plan/other costs — — — 200 82 40
Total net periodic (income)/cost $ (906) $ (936) $ 496 $ 521 $ 402 $ 835
* Reclassified to conform with 2009 presentation.
($ in millions)
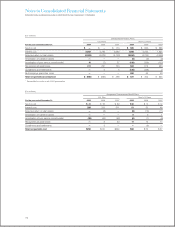
Nonpension Postretirement Benefit Plans
U.S. Plan Non-U.S. Plans
For the year ended December 31: 2009 2008 2007 2009 2008 2007
Service cost $ 41 $ 55 $ 69 $10 $ 10 $ 12
Interest cost 289 312 311 51 53 46
Expected return on plan assets — (8) — (8) (10) (11)
Amortization of transition assets — — — 0 0 1
Amortization of prior service costs/(credits) (39) (62) (62) (6) (7) (8)
Recognized actuarial losses — 9 24 11 14 17
Curtailments and settlements — 3 — — (6) —
Total net periodic cost $292 $310 $342 $58 $ 53 $ 57
112