IBM 2009 Annual Report Download - page 15
Download and view the complete annual report
Please find page 15 of the 2009 IBM annual report below. You can navigate through the pages in the report by either clicking on the pages listed below, or by using the keyword search tool below to find specific information within the annual report.-
 1
1 -
2
-
3
-
4
-
 5
5 -
 6
6 -
 7
7 -
 8
8 -
 9
9 -
 10
10 -
 11
11 -
 12
12 -
 13
13 -
 14
14 -
 15
15 -
 16
16 -
 17
17 -
 18
18 -
 19
19 -
 20
20 -
 21
21 -
 22
22 -
 23
23 -
 24
24 -
 25
25 -
26
-
27
-
28
-
29
-
30
-
31
-
32
-
33
-
34
-
35
-
36
-
37
-
38
-
39
-
40
-
41
-
42
-
43
-
44
-
45
-
46
-
47
-
48
-
49
-
50
-
51
-
52
-
53
-
54
-
55
-
56
-
57
-
58
-
59
-
60
-
61
-
62
-
63
-
64
-
65
-
66
-
67
-
68
-
69
-
70
-
71
-
72
-
73
-
74
-
75
-
76
-
77
-
78
-
79
-
80
-
81
-
82
-
83
-
84
-
85
-
86
-
87
-
88
-
89
-
90
-
91
-
92
-
93
-
94
-
95
-
96
-
97
-
98
-
99
-
100
-
101
-
102
-
103
-
104
-
105
-
106
-
107
-
108
-
109
-
110
-
111
-
112
-
113
-
114
-
115
-
116
-
117
-
118
-
119
-
120
-
121
-
122
-
123
-
124
-
125
-
126
-
127
-
128
-
129
-
130
-
131
-
132
-
133
-
134
-
135
-
136
 |
 |

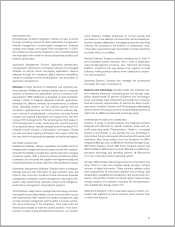
Key Drivers for 2010
Historical revenue
growth
We maintain historical
revenue growth through
annuity businesses, global
presence and a balanced
business mix.
Margin
expansion
We focus on delivering
higher value to clients and
on increasing productivity,
to improve profitability.
Share
repurchases
Our strong cash generation
lets us return value
to shareholders by reducing
shares outstanding while
reinvesting for future growth.
Growth initiatives and
future acquisitions
We invest in key growth
initiatives and strategic
acquisitions to complement
and scale our product
portfolio.
Retirement-related
costs
Retirement-related costs
vary based on market
performance and plan
redesigns.
Note: 2006
–
2008 EPS reects the adoption of amendments to ASC 260, “Earnings Per Share”
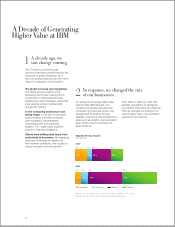
The transformation of our company has allowed us to achieve consistently strong results since 2002.
And despite a challenging economy over the last two years, we reached the target of our 2010 EPS
road map of $10 to $11 one year ahead of schedule.
This has resulted in strong, steady performance in
the current economic environment . . .6
2006 2007 2008 2009 2010
$6.05
$7.15
$8.89
$10.01
$11.00
18%
24%
13%
10%
0
2
4
6
8
10
$12
$10.00
Earnings Per Share Road Map to 2010
13
A DECADE OF GENERATING HIGHER VALUE AT IBM