IBM 2009 Annual Report Download - page 122
Download and view the complete annual report
Please find page 122 of the 2009 IBM annual report below. You can navigate through the pages in the report by either clicking on the pages listed below, or by using the keyword search tool below to find specific information within the annual report.-
 1
1 -
2
-
3
-
4
-
5
-
6
-
7
-
8
-
9
-
10
-
11
-
12
-
13
-
14
-
15
-
16
-
17
-
18
-
19
-
20
-
21
-
22
-
23
-
24
-
25
-
26
-
27
-
28
-
29
-
30
-
31
-
32
-
33
-
34
-
35
-
36
-
37
-
38
-
39
-
40
-
41
-
42
-
43
-
44
-
45
-
46
-
47
-
48
-
49
-
50
-
51
-
52
-
53
-
54
-
55
-
56
-
57
-
58
-
59
-
60
-
61
-
62
-
63
-
64
-
65
-
66
-
67
-
68
-
69
-
70
-
71
-
72
-
73
-
74
-
75
-
76
-
77
-
78
-
79
-
80
-
81
-
82
-
83
-
84
-
85
-
86
-
87
-
88
-
89
-
90
-
91
-
92
-
93
-
94
-
95
-
96
-
97
-
98
-
99
-
100
-
101
-
102
-
103
-
104
-
105
-
106
-
107
-
108
-
109
-
110
-
111
-
 112
112 -
 113
113 -
 114
114 -
 115
115 -
 116
116 -
 117
117 -
 118
118 -
 119
119 -
 120
120 -
 121
121 -
 122
122 -
 123
123 -
 124
124 -
 125
125 -
 126
126 -
 127
127 -
 128
128 -
 129
129 -
 130
130 -
 131
131 -
 132
132 -
133
-
134
-
135
-
136
 |
 |

Notes to Consolidated Financial Statements
INTERNATIONAL BUSINESS MACHINES CORPORATION AND SUBSIDIARY COMPANIES
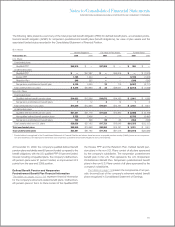
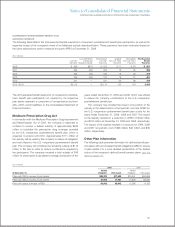
Exchange traded derivatives are valued at the closing price
reported on the exchange on which the individual securities are
traded, while forward contracts are valued using a mid-close
price. Over-the-counter derivatives are typically valued using
pricing models. The models require a variety of inputs, including,
for example, yield curves, credit curves, measures of volatility
and foreign exchange rates. These assets are classified as Level
1 or Level 2 depending on availability of quoted market prices.
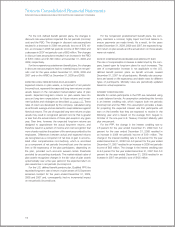
Expected Contributions
DEFINED BENEFIT PENSION PLANS
It is the company’s general practice to fund amounts for pen-
sions sufficient to meet the minimum requirements set forth in
applicable employee benefits laws and local tax laws. From
time to time, the company contributes additional amounts as it
deems appropriate.
The company contributed $1,252 million and $917 million
in cash to non-U.S. plans, including non-U.S. multi-employer
plans, during the years ended December 31, 2009 and 2008,
respectively.
In 2010, the company is not legally required to make any
contributions to the U.S. defined benefit pension plans. However,
depending on market conditions, or other factors, the company
may elect to make discretionary contributions to the Qualified
PPP during the year.
The Pension Protection Act of 2006 (the Act), enacted into
law in 2006, is a comprehensive reform package that, among
other provisions, increases pension funding requirements for cer-
tain U.S. defined benefit plans, provides guidelines for measuring
pension plan assets and pension obligations for funding purposes
and raises tax deduction limits for contributions to retirement-
related benefit plans. The additional funding requirements by the
Act apply to plan years beginning after December 31, 2007. The
Act was updated by the Worker, Retiree and Employer Recovery
Act of 2008, which revised the funding requirements in the Act
by clarifying that the company may smooth the change in value
of pension plan assets over 24 months. At December 31, 2009,
no mandatory contribution is required for 2010.
In 2010, the company estimates contributions to its non-
U.S. plans to be approximately $800 million, which will be
mainly contributed to defined benefit pension plans in Japan,
the Nether lands, Switzerland and the United Kingdom. This
amount represents the legally mandated minimum contributions.
Financial market performance in 2010 could increase the legally
mandated minimum contribution in certain countries which
require monthly or daily remeasurement of the funded status.
The company could also elect to contribute more than the legally
mandated amount based on market conditions or other factors.
NONPENSION POSTRETIREMENT BENEFIT PLANS
The company contributed $293 million and $10 million to the
nonpension postretirement benefit plans during the years ended
December 31, 2009 and 2008. These contribution amounts
exclude the Medicare-related subsidy discussed below.
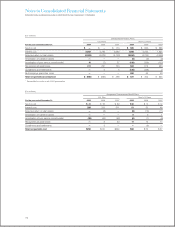
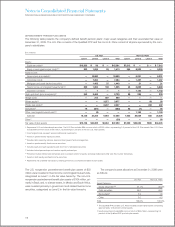
Expected Benefit Payments
DEFINED BENEFIT PENSION PLAN EXPECTED PAYMENTS
The following table presents the total expected benefit payments
to defined benefit pension plan participants. These payments
have been estimated based on the same assumptions used to
measure the plans’ PBO at December 31, 2009 and include
benefits attributable to estimated future compensation increases,
where applicable.
($ in millions)
Qualified Nonqualified Qualified Nonqualified Total Expected
U.S. Plan U.S. Plans Non-U.S. Plans Non-U.S. Plans Benefit
Payments Payments Payments Payments Payments
2010 $ 3,375 $ 91 $ 2,079 $ 314 $ 5,860
2011 3,262 91 1,951 315 5,620
2012 3,276 92 1,971 324 5,664
2013 3,291 95 1,989 333 5,709
2014 3,316 97 2,022 337 5,772
2015
–
2019 16,692 518 10,536 1,843 29,590
The 2010 expected benefit payments to defined benefit pension plan participants not covered by the respective plan assets (under-
funded plans) represent a component of compensation and benefits, within current liabilities, in the Consolidated Statement of
Financial Position.
120