IBM 2009 Annual Report Download - page 62
Download and view the complete annual report
Please find page 62 of the 2009 IBM annual report below. You can navigate through the pages in the report by either clicking on the pages listed below, or by using the keyword search tool below to find specific information within the annual report.-
 1
1 -
2
-
3
-
4
-
5
-
6
-
7
-
8
-
9
-
10
-
11
-
12
-
13
-
14
-
15
-
16
-
17
-
18
-
19
-
20
-
21
-
22
-
23
-
24
-
25
-
26
-
27
-
28
-
29
-
30
-
31
-
32
-
33
-
34
-
35
-
36
-
37
-
38
-
39
-
40
-
41
-
42
-
43
-
44
-
45
-
46
-
47
-
48
-
49
-
50
-
51
-
 52
52 -
 53
53 -
 54
54 -
 55
55 -
 56
56 -
 57
57 -
 58
58 -
 59
59 -
 60
60 -
 61
61 -
 62
62 -
 63
63 -
 64
64 -
 65
65 -
 66
66 -
 67
67 -
 68
68 -
 69
69 -
 70
70 -
 71
71 -
 72
72 -
73
-
74
-
75
-
76
-
77
-
78
-
79
-
80
-
81
-
82
-
83
-
84
-
85
-
86
-
87
-
88
-
89
-
90
-
91
-
92
-
93
-
94
-
95
-
96
-
97
-
98
-
99
-
100
-
101
-
102
-
103
-
104
-
105
-
106
-
107
-
108
-
109
-
110
-
111
-
112
-
113
-
114
-
115
-
116
-
117
-
118
-
119
-
120
-
121
-
122
-
123
-
124
-
125
-
126
-
127
-
128
-
129
-
130
-
131
-
132
-
133
-
134
-
135
-
136
 |
 |

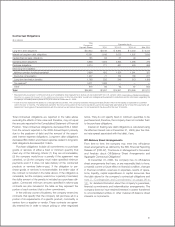
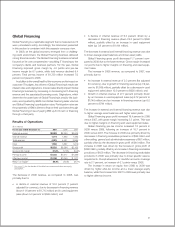
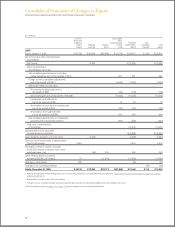
Unguaranteed Residual Value
($ in millions)
Total Estimated Run Out of 2009 Balance
2008 2009 2010 2011 2012 2013 and Beyond
Sales-type and direct financing leases $ 916 $ 849 $203 $271 $271 $104
Operating leases 378 351 166 112 62 11
Total unguaranteed residual value $ 1,294 $ 1,200 $369 $383 $333 $115
Related original amount financed $21,000 $20,687
Percentage 6.2% 5.8%
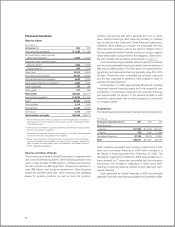
Debt
At December 31: 2009 2008
Debt-to-equity ratio 7.1x 7.0x
The company funds Global Financing through borrowings using
a debt-to-equity ratio target of approximately 7 to 1. The debt
used to fund Global Financing assets is composed of intercom-
pany loans and external debt. The terms of the intercompany
loans are set by the company to substantially match the term
and currency underlying the financing receivable and are based
on arm’s-length pricing. Both assets and debt are presented in
the Global Financing Balance Sheet on page 58.
The Global Financing business provides funding predominantly
for the company’s external clients but also provides intercompany
financing for the company. Since the company measures Global
Financing as if it were a standalone entity, interest expense relat-
ing to debt supporting Global Financing’s external client and
internal business is included in the “Global Financing Results of
Operations” on page 57 and in note V, “Seg ment Information,”
on pages 122 to 126.
In the company’s Consolidated Statement of Earnings on
page 64, however, the external debt-related interest expense
supporting Global Financing’s internal financing to the company
is reclassified from cost of financing to interest expense.
The following table provides additional information on total
company debt. In this table, intercompany activity includes
internal loans and leases at arm’s-length pricing in support of
Global Services’ long-term contracts and other internal activity.
The company believes these assets should be appropriately lev-
eraged in line with the overall Global Financing business model.
($ in millions)
December 31, 2009 December 31, 2008
Global Financing Segment: $22,383 $24,360
Debt to support external clients $19,091 $20,892
Debt to support internal clients 3,292 3,468
Non-Global Financing Segments: 3,717 9,566
Debt supporting operations 7,008 13,034
Intercompany activity (3,292) (3,468)
Total company debt $26,099 $33,926
60