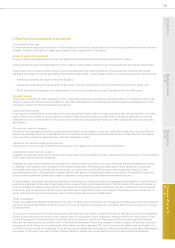
Experian 2010 Annual Report Download - page 91
Download and view the complete annual report
Please find page 91 of the 2010 Experian annual report below. You can navigate through the pages in the report by either clicking on the pages listed below, or by using the keyword search tool below to find specific information within the annual report.
89
Introduction
2 – 11
Business review
12 – 51
Governance
52 – 84
Financial statements
85 – 160
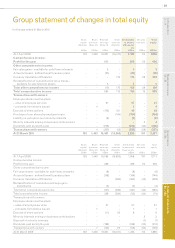
Group statement of changes in total equity
for the year ended 31 March 2010
Share
capital
(Note 33)
US$m
Share
premium
(Note 33)
US$m
Retained
earnings
(Note 34)
US$m
Other
reserves
(Note 34)
US$m
Attributable
to owners
of Experian
plc
US$m
Minority
interests
US$m
To t a l
equity
US$m
At 1 April 2009 102 1,449 16,251 (16,017) 1,785 114 1,899
Comprehensive income:
Prot for the year - - 600 - 600 36 636
Other comprehensive income:
Fair value gains – available for sale nancial assets - - 5 - 5- 5
Actuarial losses - dened benet pension plans - - (20) - (20) - (20)
Currency translation differences - - - 170 170 39 209
Reclassication of cumulative fair value losses -
available for sale nancial assets - - 5 - 5- 5
Total other comprehensive income - - (10) 170 160 39 199
Total comprehensive income - - 590 170 760 75 835
Transactions with owners:
Employee share incentive plans:
– value of employee services - - 67 - 67 - 67
– proceeds from shares issued - 4 - - 4 - 4
Exercise of share options - - (103) 151 48 - 48
Purchase of own shares by employee trusts - - - (164) (164) - (164)
Liability on put option over minority interests - - (8) - (8) - (8)
Minority interests arising on business combinations - - - - - 4 4
Dividends paid during the year - - (206) - (206) (42) (248)
Transactions with owners - 4 (250) (13) (259) (38) (297)
At 31 March 2010 102 1,453 16,591 (15,860) 2,286 151 2,437
Share
capital
(Note 33)
US$m
Share
premium
(Note 33)
US$m
Retained
earnings
(Note 34)
US$m
Other
reserves
(Note 34)
US$m
Attributable
to owners of
Experian plc
US$m
Minority
interests
US$m
Tot a l
equity
US$m
At 1 April 2008 102 1,442 16,065 (15,653) 1,956 161 2,117
Comprehensive income:
Prot for the year - - 486 - 486 20 506
Other comprehensive income:
Fair value losses - available for sale nancial assets - - (8) - (8) - (8)
Actuarial losses - dened benet pension plans - - (146) - (146) - (146)
Currency translation differences - - - (384) (384) (44) (428)
Reclassication of cumulative exchange gain -
divestments - - (3) - (3) - (3)
Total other comprehensive income - - (157) (384) (541) (44) (585)
Total comprehensive income - - 329 (384) (55) (24) (79)
Transactions with owners:
Employee share incentive plans:
– value of employee services - - 57 - 57 - 57
– proceeds from shares issued - 7 - - 7 - 7
Exercise of share options - - (11) 20 9 - 9
Minority interests arising on business combinations - - - - - 2 2
Disposal of minority interests - - - - - (1) (1)
Dividends paid during the year - - (189) - (189) (24) (213)
Transactions with owners - 7 (143) 20 (116) (23) (139)
At 31 March 2009 102 1,449 16,251 (16,017) 1,785 114 1,899


