Experian 2010 Annual Report Download - page 120
Download and view the complete annual report
Please find page 120 of the 2010 Experian annual report below. You can navigate through the pages in the report by either clicking on the pages listed below, or by using the keyword search tool below to find specific information within the annual report.-
 1
1 -
2
-
3
-
4
-
5
-
6
-
7
-
8
-
9
-
10
-
11
-
12
-
13
-
14
-
15
-
16
-
17
-
18
-
19
-
20
-
21
-
22
-
23
-
24
-
25
-
26
-
27
-
28
-
29
-
30
-
31
-
32
-
33
-
34
-
35
-
36
-
37
-
38
-
39
-
40
-
41
-
42
-
43
-
44
-
45
-
46
-
47
-
48
-
49
-
50
-
51
-
52
-
53
-
54
-
55
-
56
-
57
-
58
-
59
-
60
-
61
-
62
-
63
-
64
-
65
-
66
-
67
-
68
-
69
-
70
-
71
-
72
-
73
-
74
-
75
-
76
-
77
-
78
-
79
-
80
-
81
-
82
-
83
-
84
-
85
-
86
-
87
-
88
-
89
-
90
-
91
-
92
-
93
-
94
-
95
-
96
-
97
-
98
-
99
-
100
-
101
-
102
-
103
-
104
-
105
-
106
-
107
-
108
-
109
-
 110
110 -
 111
111 -
 112
112 -
 113
113 -
 114
114 -
 115
115 -
 116
116 -
 117
117 -
 118
118 -
 119
119 -
 120
120 -
 121
121 -
 122
122 -
 123
123 -
 124
124 -
 125
125 -
 126
126 -
 127
127 -
 128
128 -
 129
129 -
 130
130 -
131
-
132
-
133
-
134
-
135
-
136
-
137
-
138
-
139
-
140
-
141
-
142
-
143
-
144
-
145
-
146
-
147
-
148
-
149
-
150
-
151
-
152
-
153
-
154
-
155
-
156
-
157
-
158
-
159
-
160
-
161
-
162
-
163
-
164
 |
 |

Experian Annual Report 2010 Financial statements118
Notes to the Group nancial statements (continued)
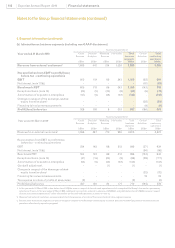
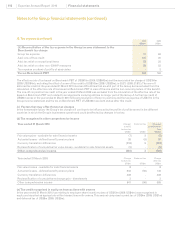
14. Basic and diluted earnings per share
Basic earnings per share is calculated by dividing the earnings attributable to ordinary shareholders of the Company by the
weighted average number of ordinary shares in issue during the year (excluding own shares held in employee trusts, which are
treated as cancelled).
The calculation of diluted earnings per share reects the potentially dilutive effect of employee share incentive plans. The
earnings gures used in the calculations are unchanged for diluted earnings per share.
Basic earnings per share: 2010
US cents
2009
US cents
Continuing and discontinued operations 59.0 48.0
Discontinued operations 0.8 (1.2)
Continuing operations 59.8 46.8
Add back of exceptional and other non-GAAP measures, net of tax 7.3 15.5
Benchmark earnings per share from continuing operations (non-GAAP measure) 67.1 62.3
Diluted earnings per share: 2010
US cents
2009
US cents
Continuing and discontinued operations 58.1 47.5
Discontinued operations 0.8 (1.2)
Continuing operations 58.9 46.3
Add back of exceptional and other non-GAAP measures, net of tax 7.2 15.3
Benchmark diluted earnings per share from continuing operations (non-GAAP measure) 66.1 61.6
Earnings attributable to owners of Experian plc: 2010
US$m
2009
US$m
Continuing and discontinued operations 600 486
Discontinued operations 8 (12)
Continuing operations 608 474
Add back of exceptional and other non-GAAP measures, net of tax 73 157
Benchmark earnings attributable to owners of Experian plc (non-GAAP measure) 681 631
Earnings attributable to minority interests: 2010
US$m
2009
US$m
Continuing and discontinued operations 36 20
Add back of amortisation of acquisition intangibles attributable to the minority, net of tax 9 8
Benchmark earnings attributable to minority interests (non-GAAP measure) 45 28
Reconciliation of benchmark earnings to prot for the year: 2010
US$m
2009
US$m
Overall benchmark earnings (non-GAAP measure) 726 659
(Loss)/prot from discontinued operations (8) 12
Loss from exceptional and other non-GAAP measures (82) (165)
Prot for the year 636 506
Weighted average number of ordinary shares: 2010
m
2009
m
Weighted average number of ordinary shares in issue during the year 1,015 1,013
Dilutive effect of share incentive awards 15 12
Diluted weighted average number of ordinary shares 1,030 1,025