Experian 2010 Annual Report Download - page 40
Download and view the complete annual report
Please find page 40 of the 2010 Experian annual report below. You can navigate through the pages in the report by either clicking on the pages listed below, or by using the keyword search tool below to find specific information within the annual report.-
 1
1 -
2
-
3
-
4
-
5
-
6
-
7
-
8
-
9
-
10
-
11
-
12
-
13
-
14
-
15
-
16
-
17
-
18
-
19
-
20
-
21
-
22
-
23
-
24
-
25
-
26
-
27
-
28
-
29
-
 30
30 -
 31
31 -
 32
32 -
 33
33 -
 34
34 -
 35
35 -
 36
36 -
 37
37 -
 38
38 -
 39
39 -
 40
40 -
 41
41 -
 42
42 -
 43
43 -
 44
44 -
 45
45 -
 46
46 -
 47
47 -
 48
48 -
 49
49 -
 50
50 -
51
-
52
-
53
-
54
-
55
-
56
-
57
-
58
-
59
-
60
-
61
-
62
-
63
-
64
-
65
-
66
-
67
-
68
-
69
-
70
-
71
-
72
-
73
-
74
-
75
-
76
-
77
-
78
-
79
-
80
-
81
-
82
-
83
-
84
-
85
-
86
-
87
-
88
-
89
-
90
-
91
-
92
-
93
-
94
-
95
-
96
-
97
-
98
-
99
-
100
-
101
-
102
-
103
-
104
-
105
-
106
-
107
-
108
-
109
-
110
-
111
-
112
-
113
-
114
-
115
-
116
-
117
-
118
-
119
-
120
-
121
-
122
-
123
-
124
-
125
-
126
-
127
-
128
-
129
-
130
-
131
-
132
-
133
-
134
-
135
-
136
-
137
-
138
-
139
-
140
-
141
-
142
-
143
-
144
-
145
-
146
-
147
-
148
-
149
-
150
-
151
-
152
-
153
-
154
-
155
-
156
-
157
-
158
-
159
-
160
-
161
-
162
-
163
-
164
 |
 |

Experian Annual Report 2010 Business review38
Financial review
Experian has delivered a strong performance against a backdrop of tough
market conditions and has reported revenue growth and good prot and cash
performance.
During the year, and as previously
announced, Experian completed the
closure of its Canadian credit bureau
and terminated its joint venture bureau
in Japan.
The loss on disposal of businesses in
the year primarily arose as a result of
the disposal of the National Business
Database in North America.
Demerger and related restructuring
costs in the year ended 31 March 2009
comprised legal and professional
fees, together with costs in connection
with the cessation of a number of
subsidiaries of the former GUS plc.
Interest
In the year ended 31 March 2010, the
net interest expense was US$81m
(2009: US$96m), after charging US$1m
(2009: crediting US$17m) in respect of
the differential between the expected
return on pension assets and interest
on pension liabilities. The reduction of
US$33m in the other elements of the
net interest expense reects the benet
from the environment of low global
interest rates together with the strong
cash ow performance.
Ta x
The effective rate of tax for the year
based on Benchmark PBT was 20.2%
(2009: 21.8%). This rate is dened as
the total tax expense, adjusted for the
tax impact of non-Benchmark items,
divided by Benchmark PBT. A one-
off deferred tax credit of US$105m is
excluded from the calculation of this
rate in the year ended 31 March 2010 in
view of the size and the non-recurring
nature of this benet. A one-off
corporation tax credit of US$20m was
excluded from the calculation of this
rate in the year ended 31 March 2009
as it related to arrangements involving
entities no longer part of the Group.
The cash tax rate for continuing
operations (based on tax paid in the
year and Benchmark PBT for continuing
operations) was 5.3% (2009: 4.6%).
Revenue and prot performance –
continuing operations
Revenue increased from US$3,873m
in the year ended 31 March 2009 to
US$3,880m in the year ended 31 March
2010. At constant exchange rates,
organic revenue growth was 2%.
Prot before tax increased by 14%, from
US$578m to US$661m.
Benchmark PBT rose by US$67m to
US$910m (2009: US$843m). Organic
revenue growth of 2% translated into
growth in EBIT at constant exchange
rates of 6% to US$991m, with margin
improvement of 80 basis points to
24.4%. Margin strength reects further
benets from the previously announced
strategic cost efciency programme,
as well as positive operating leverage in
Latin America.
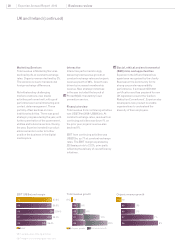
Exceptional items – continuing
operations
Expenditure of US$41m arose in the
year in connection with the strategic
programme of cost efciency
measures. Of this, US$21m related
to redundancy, US$17m related to
offshoring activities, other restructuring
and infrastructure consolidation costs
and US$3m related to asset write-offs.
During the year, Experian recognised
a loss of US$4m in connection with
arrangements with FARES primarily
as a result of the reclassication
through the Group income statement
of earlier losses in respect of holdings
of First Advantage Corporation Class
A common stock. Further details of
the arrangements and transactions in
respect of FARES are given in note 19 to
the Group nancial statements.
Exceptional items - continuing operations
Year ended 31 March
2010
US$m
2009
US$m
Restructuring costs 41 92
Loss arising in connection with arrangements
with FARES 4-
Cessation of bureau activities 315
Loss on disposal of businesses 24 3
Demerger and related restructuring costs -7
Total exceptional items 72 117
122