Experian 2010 Annual Report Download - page 22
Download and view the complete annual report
Please find page 22 of the 2010 Experian annual report below. You can navigate through the pages in the report by either clicking on the pages listed below, or by using the keyword search tool below to find specific information within the annual report.-
 1
1 -
2
-
3
-
4
-
5
-
6
-
7
-
8
-
9
-
10
-
11
-
 12
12 -
 13
13 -
 14
14 -
 15
15 -
 16
16 -
 17
17 -
 18
18 -
 19
19 -
 20
20 -
 21
21 -
 22
22 -
 23
23 -
 24
24 -
 25
25 -
 26
26 -
 27
27 -
 28
28 -
 29
29 -
 30
30 -
 31
31 -
 32
32 -
33
-
34
-
35
-
36
-
37
-
38
-
39
-
40
-
41
-
42
-
43
-
44
-
45
-
46
-
47
-
48
-
49
-
50
-
51
-
52
-
53
-
54
-
55
-
56
-
57
-
58
-
59
-
60
-
61
-
62
-
63
-
64
-
65
-
66
-
67
-
68
-
69
-
70
-
71
-
72
-
73
-
74
-
75
-
76
-
77
-
78
-
79
-
80
-
81
-
82
-
83
-
84
-
85
-
86
-
87
-
88
-
89
-
90
-
91
-
92
-
93
-
94
-
95
-
96
-
97
-
98
-
99
-
100
-
101
-
102
-
103
-
104
-
105
-
106
-
107
-
108
-
109
-
110
-
111
-
112
-
113
-
114
-
115
-
116
-
117
-
118
-
119
-
120
-
121
-
122
-
123
-
124
-
125
-
126
-
127
-
128
-
129
-
130
-
131
-
132
-
133
-
134
-
135
-
136
-
137
-
138
-
139
-
140
-
141
-
142
-
143
-
144
-
145
-
146
-
147
-
148
-
149
-
150
-
151
-
152
-
153
-
154
-
155
-
156
-
157
-
158
-
159
-
160
-
161
-
162
-
163
-
164
 |
 |
Experian Annual Report 2010 Business review20
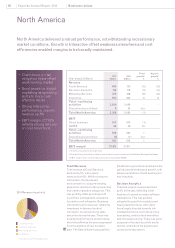
North America (continued)
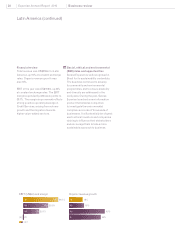
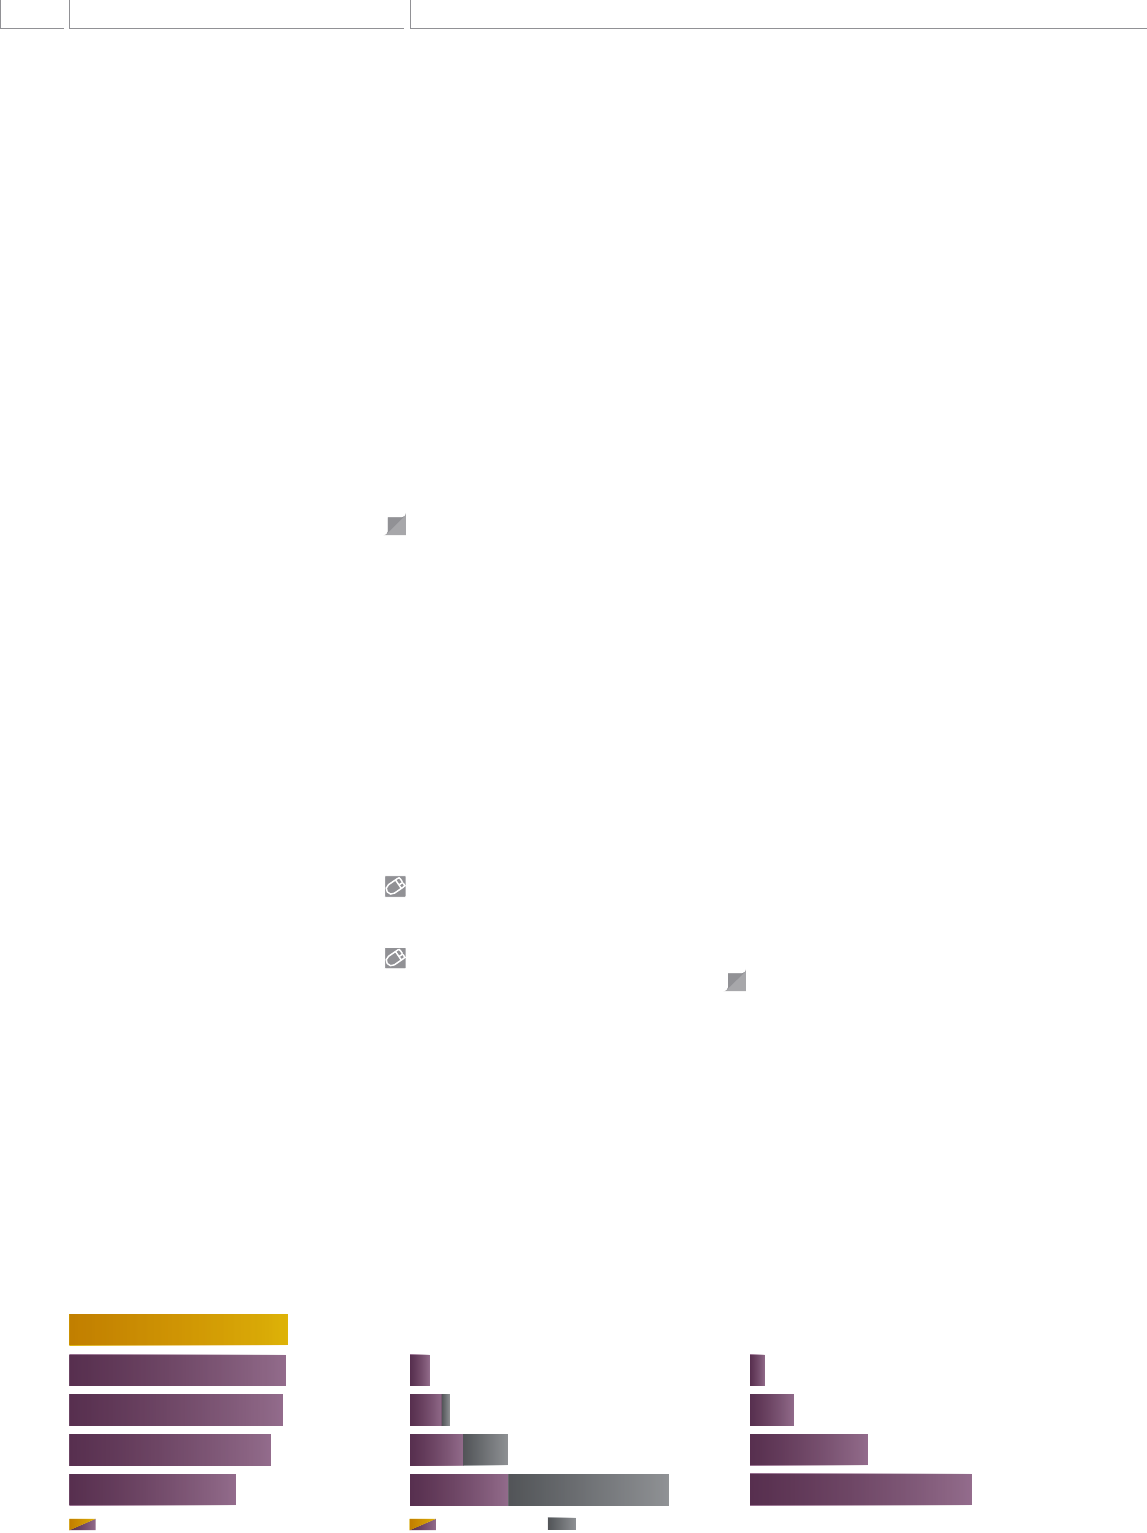
Total revenue growth Organic revenue growth
from databreach revenue. Product
and user experience enhancements
contributed to improved retention
rates, while the new identity monitoring
product ProtectMyID performed in
line with expectations, with good order
volume growth since launch.
On 23 February 2010, Experian received
nal rules from the Federal Trade
Commission (FTC) governing the
marketing of free credit reports to
US consumers. These regulations
require specic disclosures and links
to the FTC-sponsored website. With
effect from 1 April 2010, Experian
adapted its marketing strategy and
switched all broadcast and internet
advertising placements to a new
consumer brand, freecreditscore.
com. Based on recent dialogue with
the Federal Trade Commission, further
changes to the freecreditreport.com
site were implemented to resolve
lingering concerns about disclosures
in advertising.
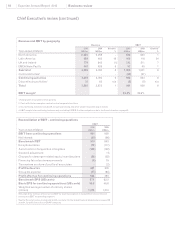
Financial review
Total revenue for the year from
continuing activities was US$2,060m
(2009: US$2,059m).
EBIT from direct businesses was
US$572m (2009: US$575m), a decrease
of 1% in the year, giving an EBIT margin
of 27.8% (2009: 27.9%).
The margin performance reected
strong delivery on cost reductions,
including some one-off benets, which
helped to offset negative operating
leverage in Credit Services and
Marketing Services.
EBIT from FARES, the 20%-owned
real estate information associate,
increased to US$56m (2009: US$48m),
driven by higher mortgage renancing
activity.
Social, ethical and environmental
(SEE) risks and opportunities
Experian in North America delivered a
programme of energy saving measures
across its data centres, as well as
engaging employees in volunteering
and online charitable donations and
considerably expanding the reach of its
consumer education programme.
Marketing Services
Total and organic revenue at Marketing
Services declined by 8%. In the early
part of the year, contraction in retail
spending impacted the traditional
activities of list processing, data and
database, although there were signs
of stabilisation as the year progressed.
Digital media activities delivered good
growth, reecting the ongoing shift to
more cost-effective and more targeted
channels. During the year, Experian
has invested in new capabilities and
innovative new products to strengthen
its market position and provide new
growth opportunities as the economy
recovers.
Interactive
Total and organic revenue growth was
8% at Interactive. There was strong
growth in lead generation, driven by an
excellent performance in the education
vertical, reecting client gains, and an
improving trend in the year within the
lending vertical. Comparison shopping
revenues beneted from a number of
new partnerships with co-branded
partners. Increased membership
revenue and afnity channel
penetration drove growth at Consumer
Direct, offsetting a lower contribution
10 0%
08 3%
07 8%
06 15%
1%
09
Organic growth Acquired growth
09 1%
0%10
EBIT (US$m) and margin
EBIT excludes discontinuing activities
EBIT margin is for continuing direct business only
and excludes FARES
EBIT
27.8%10 628
26.9%08 608
25.8%07 573
23.3%06 473
27.9%
09 623
06 40%
15%
07
08 4%
49
48