Experian 2010 Annual Report Download - page 42
Download and view the complete annual report
Please find page 42 of the 2010 Experian annual report below. You can navigate through the pages in the report by either clicking on the pages listed below, or by using the keyword search tool below to find specific information within the annual report.-
 1
1 -
2
-
3
-
4
-
5
-
6
-
7
-
8
-
9
-
10
-
11
-
12
-
13
-
14
-
15
-
16
-
17
-
18
-
19
-
20
-
21
-
22
-
23
-
24
-
25
-
26
-
27
-
28
-
29
-
30
-
31
-
 32
32 -
 33
33 -
 34
34 -
 35
35 -
 36
36 -
 37
37 -
 38
38 -
 39
39 -
 40
40 -
 41
41 -
 42
42 -
 43
43 -
 44
44 -
 45
45 -
 46
46 -
 47
47 -
 48
48 -
 49
49 -
 50
50 -
 51
51 -
 52
52 -
53
-
54
-
55
-
56
-
57
-
58
-
59
-
60
-
61
-
62
-
63
-
64
-
65
-
66
-
67
-
68
-
69
-
70
-
71
-
72
-
73
-
74
-
75
-
76
-
77
-
78
-
79
-
80
-
81
-
82
-
83
-
84
-
85
-
86
-
87
-
88
-
89
-
90
-
91
-
92
-
93
-
94
-
95
-
96
-
97
-
98
-
99
-
100
-
101
-
102
-
103
-
104
-
105
-
106
-
107
-
108
-
109
-
110
-
111
-
112
-
113
-
114
-
115
-
116
-
117
-
118
-
119
-
120
-
121
-
122
-
123
-
124
-
125
-
126
-
127
-
128
-
129
-
130
-
131
-
132
-
133
-
134
-
135
-
136
-
137
-
138
-
139
-
140
-
141
-
142
-
143
-
144
-
145
-
146
-
147
-
148
-
149
-
150
-
151
-
152
-
153
-
154
-
155
-
156
-
157
-
158
-
159
-
160
-
161
-
162
-
163
-
164
 |
 |

Experian Annual Report 2010 Business review40
Earnings and dividends per share
Basic earnings per share were 59.0 US
cents (2009: 48.0 US cents), after a loss
of 0.8 US cents (2009: earnings of 1.2
US cents) in respect of discontinued
operations. Benchmark earnings per
share increased to 67.1 US cents from
62.3 US cents last year.
The second interim dividend for the
year, to be paid in July 2010, is 16 US
cents per ordinary share (2009: 13.25
US cents) giving a total dividend per
share for the year of 23 US cents (2009:
20 US cents), an increase of 15%. The
total dividend is covered 2.9 times by
Benchmark earnings per share. In
view of Experian’s continuing strong
cash ow generation, it is proposed to
reduce dividend cover from three times
to around two and a half times over the
next twelve months.
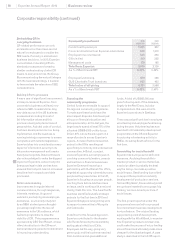
Cash ow and net debt
Experian continued to be strongly cash
generative in the year with operating
cash ow of US$976m (2009: US$927m)
and a cash ow conversion of 98%
(2009: 99%).
As indicated in the table opposite, free
cash ow in the year ended 31 March
2010 was US$818m (2009: US$736m)
and funded acquisitions of US$41m
(2009: US$179m) and equity dividends of
US$206m (2009: US$189m). Acquisition
expenditure included the settlement
of contingent consideration of US$9m
(2009: US$59m) in respect of prior
year acquisitions. Cash outow from
exceptional items was US$62m (2009:
US$102m) and there was a cash inow
on disposals, primarily in respect of
FARES, of US$107m. The net cash
inow for the year was US$609m (2009:
US$428m). Other nancing related cash
ows include US$114m in respect of net
share purchases by employee trusts
and for employee share incentive plans.
Financial review (continued)
Cash ow summary
Year ended 31 March
2010
US$m
2009
US$m
EBIT from continuing operations 991 939
Depreciation and amortisation 274 273
Loss on sale of xed assets 19
Capital expenditure (314) (305)
Sale of property, plant and equipment 30 -
Change in working capital (22) 7
Prot retained in associate (17) (16)
Charge in respect of equity incentive plans within
Benchmark PBT 33 20
Operating cash ow1976 927
Net interest paid (68) (128)
Tax paid (48) (39)
Dividends paid to minority shareholders (42) (24)
Free cash ow 818 736
Net cash outow from exceptional items (62) (102)
Acquisitions (41) (179)
Purchase of investments (7) (29)
Disposal of other nancial assets and investments in
associates 118 -
Disposal of transaction processing activities
in France (17) 191
Disposal of other businesses 6-
Equity dividends paid (206) (189)
Net cash ow 609 428
Foreign exchange movements 35 (37)
Other nancing related cash ows (608) (394)
Movement in cash and cash equivalents –
continuing operations 36 (3)
Movement in cash equivalents – discontinued
operations -(17)
Movement in cash and cash equivalents 36 (20)
1. A reconciliation of cash generated from operations as reported in the Group cash ow statement
on page 90 to operating cash ow as reported above is given in note 35 to the Group nancial
statements.
Cash ow conversion is dened as operating cash ow expressed as a percentage of EBIT from
continuing operations.
Reconciliation of depreciation and amortisation
Year ended 31 March
2010
US$m
2009
US$m
As reported in the notes to the Group cash ow
statement 417 420
Less: amortisation of acquisition intangibles (140) (132)
Less: exceptional asset write-off (3) (15)
As reported above 274 273