Experian 2010 Annual Report Download - page 48
Download and view the complete annual report
Please find page 48 of the 2010 Experian annual report below. You can navigate through the pages in the report by either clicking on the pages listed below, or by using the keyword search tool below to find specific information within the annual report.-
 1
1 -
2
-
3
-
4
-
5
-
6
-
7
-
8
-
9
-
10
-
11
-
12
-
13
-
14
-
15
-
16
-
17
-
18
-
19
-
20
-
21
-
22
-
23
-
24
-
25
-
26
-
27
-
28
-
29
-
30
-
31
-
32
-
33
-
34
-
35
-
36
-
37
-
 38
38 -
 39
39 -
 40
40 -
 41
41 -
 42
42 -
 43
43 -
 44
44 -
 45
45 -
 46
46 -
 47
47 -
 48
48 -
 49
49 -
 50
50 -
 51
51 -
 52
52 -
 53
53 -
 54
54 -
 55
55 -
 56
56 -
 57
57 -
 58
58 -
59
-
60
-
61
-
62
-
63
-
64
-
65
-
66
-
67
-
68
-
69
-
70
-
71
-
72
-
73
-
74
-
75
-
76
-
77
-
78
-
79
-
80
-
81
-
82
-
83
-
84
-
85
-
86
-
87
-
88
-
89
-
90
-
91
-
92
-
93
-
94
-
95
-
96
-
97
-
98
-
99
-
100
-
101
-
102
-
103
-
104
-
105
-
106
-
107
-
108
-
109
-
110
-
111
-
112
-
113
-
114
-
115
-
116
-
117
-
118
-
119
-
120
-
121
-
122
-
123
-
124
-
125
-
126
-
127
-
128
-
129
-
130
-
131
-
132
-
133
-
134
-
135
-
136
-
137
-
138
-
139
-
140
-
141
-
142
-
143
-
144
-
145
-
146
-
147
-
148
-
149
-
150
-
151
-
152
-
153
-
154
-
155
-
156
-
157
-
158
-
159
-
160
-
161
-
162
-
163
-
164
 |
 |
Experian Annual Report 2010 Business review46
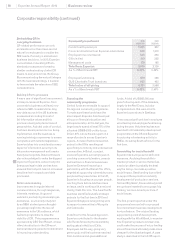
Revenue and EBIT by operating segment
2010 2009
Continuing
activities
Discontinuing
activities1Total
Continuing
activities
Discontinuing
activities1To t a l
Year ended 31 March US$m US$m US$m US$m US$m US$m
Revenue
North America 2,060 82,068 2,059 24 2,083
Latin America 559 -559 462 -462
UK and Ireland 779 13 792 843 59 902
EMEA/Asia Pacic2461 -461 426 -426
Total revenue 3,859 21 3,880 3,790 83 3,873
EBIT
North America – direct business 572 (5) 567 575 (7) 568
FARES 56 -56 48 -48
Total North America 628 (5) 623 623 (7) 616
Latin America 166 -166 118 -118
UK and Ireland 212 -212 211 2213
EMEA/Asia Pacic252 -52 49 -49
Total operating segments 1,058 (5) 1,053 1,001 (5) 996
Central Activities (62) -(62) (57) -(57)
Total EBIT 996 (5) 991 944 (5) 939
1. Discontinuing activities include UK account processing and other smaller discontinuing activities
2. EMEA/Asia Pacic represents all other operating segments
Financial review (continued)
Constant exchange rates
In order to illustrate its organic
performance, Experian discusses its
results in terms of constant exchange
rate growth, unless otherwise stated.
This represents growth calculated as if
the exchange rates used to determine
the results had remained unchanged
from those used in the previous year.
Free cash ow
Free cash ow is derived from operating
cash ow by excluding net interest and
tax paid together with dividends paid to
minority shareholders.
Roundings
Certain nancial data have been
rounded within this report. As a result
of this rounding, the totals of data
presented may vary slightly from the
actual arithmetic totals of such data.