Experian 2010 Annual Report Download - page 135
Download and view the complete annual report
Please find page 135 of the 2010 Experian annual report below. You can navigate through the pages in the report by either clicking on the pages listed below, or by using the keyword search tool below to find specific information within the annual report.-
 1
1 -
2
-
3
-
4
-
5
-
6
-
7
-
8
-
9
-
10
-
11
-
12
-
13
-
14
-
15
-
16
-
17
-
18
-
19
-
20
-
21
-
22
-
23
-
24
-
25
-
26
-
27
-
28
-
29
-
30
-
31
-
32
-
33
-
34
-
35
-
36
-
37
-
38
-
39
-
40
-
41
-
42
-
43
-
44
-
45
-
46
-
47
-
48
-
49
-
50
-
51
-
52
-
53
-
54
-
55
-
56
-
57
-
58
-
59
-
60
-
61
-
62
-
63
-
64
-
65
-
66
-
67
-
68
-
69
-
70
-
71
-
72
-
73
-
74
-
75
-
76
-
77
-
78
-
79
-
80
-
81
-
82
-
83
-
84
-
85
-
86
-
87
-
88
-
89
-
90
-
91
-
92
-
93
-
94
-
95
-
96
-
97
-
98
-
99
-
100
-
101
-
102
-
103
-
104
-
105
-
106
-
107
-
108
-
109
-
110
-
111
-
112
-
113
-
114
-
115
-
116
-
117
-
118
-
119
-
120
-
121
-
122
-
123
-
124
-
 125
125 -
 126
126 -
 127
127 -
 128
128 -
 129
129 -
 130
130 -
 131
131 -
 132
132 -
 133
133 -
 134
134 -
 135
135 -
 136
136 -
 137
137 -
 138
138 -
 139
139 -
 140
140 -
 141
141 -
 142
142 -
 143
143 -
 144
144 -
 145
145 -
146
-
147
-
148
-
149
-
150
-
151
-
152
-
153
-
154
-
155
-
156
-
157
-
158
-
159
-
160
-
161
-
162
-
163
-
164
 |
 |
133
Introduction
2 – 11
Business review
12 – 51
Governance
52 – 84
Financial statements
85 – 160
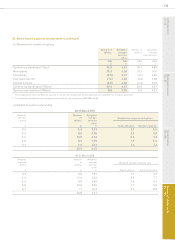
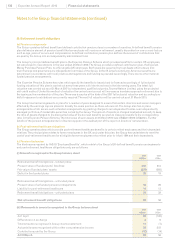
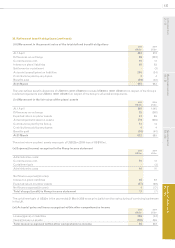
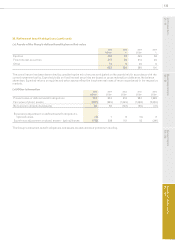
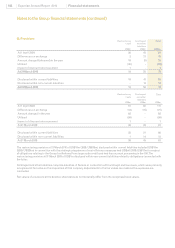
29. Share-based payment arrangements (continued)
(iv) Movement in number of options
Number of
options
Weighted
average
exercise
price
Number of
options
Weighted
average
exercise price
2010
m
2010
£
2009
m
2009
£
Options outstanding at 1 April 33.8 4.37 30.1 4.85
New grants 12.3 4.59 10.1 3.10
Forfeitures1(2.8) 4.67 (4.7) 3.65
Exercised options2(7.2) 4.40 (1.4) 4.96
Expired options (0.8) 4.38 (0.3) 4.42
Options outstanding at 31 March 35.3 4.42 33.8 4.37
Options exercisable at 31 March 8.0 4.95 6.4 4.27
1. For arrangements which are ‘Save as you earn’ in nature, this includes non-leavers who have not completed the savings requirement.
2. The weighted average share price of options exercised during the year was £5.69 (2009: £4.00).
(v) Details of options outstanding
At 31 March 2010
Range of
exercise
prices
£
Number
of
options
m
Weighted
average
exercise
price
£
Weighted average remaining lives
Expected years Contractual years
2-3 2.4 2.91 2.1 2.5
3-4 8.0 3.25 2.1 7.8
4-5 15.9 4.64 2.4 7.4
5-6 8.0 5.39 1.0 5.2
6-7 1.0 6.12 1.4 7.2
35.3 4.42
At 31 March 2009
Range of
exercise
prices
£
Number
of
options
m
Weighted
average
exercise
price
£
Weighted average remaining lives
Expected years Contractual years
2-3 2.8 2.91 3.1 3.5
3-4 10.4 3.33 2.4 7.7
4-5 8.6 4.63 0.6 4.2
5-6 10.9 5.35 1.7 5.9
6-7 1.1 6.12 2.4 8.2
33.8 4.37