Experian 2010 Annual Report Download - page 16
Download and view the complete annual report
Please find page 16 of the 2010 Experian annual report below. You can navigate through the pages in the report by either clicking on the pages listed below, or by using the keyword search tool below to find specific information within the annual report.-
 1
1 -
2
-
3
-
4
-
5
-
 6
6 -
 7
7 -
 8
8 -
 9
9 -
 10
10 -
 11
11 -
 12
12 -
 13
13 -
 14
14 -
 15
15 -
 16
16 -
 17
17 -
 18
18 -
 19
19 -
 20
20 -
 21
21 -
 22
22 -
 23
23 -
 24
24 -
 25
25 -
 26
26 -
27
-
28
-
29
-
30
-
31
-
32
-
33
-
34
-
35
-
36
-
37
-
38
-
39
-
40
-
41
-
42
-
43
-
44
-
45
-
46
-
47
-
48
-
49
-
50
-
51
-
52
-
53
-
54
-
55
-
56
-
57
-
58
-
59
-
60
-
61
-
62
-
63
-
64
-
65
-
66
-
67
-
68
-
69
-
70
-
71
-
72
-
73
-
74
-
75
-
76
-
77
-
78
-
79
-
80
-
81
-
82
-
83
-
84
-
85
-
86
-
87
-
88
-
89
-
90
-
91
-
92
-
93
-
94
-
95
-
96
-
97
-
98
-
99
-
100
-
101
-
102
-
103
-
104
-
105
-
106
-
107
-
108
-
109
-
110
-
111
-
112
-
113
-
114
-
115
-
116
-
117
-
118
-
119
-
120
-
121
-
122
-
123
-
124
-
125
-
126
-
127
-
128
-
129
-
130
-
131
-
132
-
133
-
134
-
135
-
136
-
137
-
138
-
139
-
140
-
141
-
142
-
143
-
144
-
145
-
146
-
147
-
148
-
149
-
150
-
151
-
152
-
153
-
154
-
155
-
156
-
157
-
158
-
159
-
160
-
161
-
162
-
163
-
164
 |
 |

Experian Annual Report 2010 Business review14
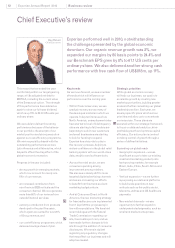
Chief Executive’s review (continued)
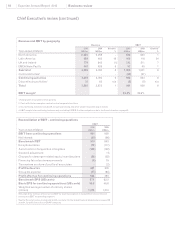
Revenue and EBIT by geography
Revenue EBIT
Year ended 31 March
2010
US$m
2009
US$m
Growth1
%
2010
US$m
2009
US$m
Growth1
%
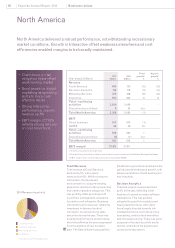
North America 2,060 2,059 -628 623 1
Latin America 559 462 16 166 118 34
UK and Ireland 779 843 (1) 212 211 7
EMEA/Asia Pacic 461 426 652 49 1
Sub total 3,859 3,790 21,058 1,001 6
Central Activities2-- - (62) (57)
Continuing activities 3,859 3,790 2996 944 6
Discontinuing activities321 83 n/a (5) (5) n/a
To t a l 3,880 3,873 1991 939 6
EBIT margin424.4% 23.6%
1. Total growth at constant exchange rates
2. Central Activities comprise costs of central corporate functions
3. Discontinuing activities include UK account processing and other smaller discontinuing activities
4. EBIT margin is for continuing business only, excluding FARES. Further analysis can be in the nancial review on page 45
Reconciliation of EBIT – continuing operations
EBIT
Year ended 31 March
2010
US$m
2009
US$m
EBIT from continuing operations 991 939
Net interest (81) (96)
Benchmark PBT 910 843
Exceptional items (72) (117)
Amortisation of acquisition intangibles (140) (132)
Goodwill adjustment -(1)
Charges for demerger-related equity incentive plans (28) (32)
Financing fair value remeasurements (9) 19
Tax expense on share of prots of associates -(2)
Prot before tax 661 578
Group tax expense (17) (84)
Prot after tax for continuing operations 644 494
Benchmark EPS (US cents) 67.1 62.3
Basic EPS for continuing operations (US cents) 59.8 46.8
Weighted average number of ordinary shares
(million) 1,015 1,013
See page 45 for analysis of revenue and EBIT by business segment and page 46 for reconciliation of
revenue and EBIT by operating segment
See the nancial review on pages 44 and 45, and note 4 to the Group nancial statements on pages 100
and 101, for denitions of non-GAAP measures