Experian 2010 Annual Report Download - page 78
Download and view the complete annual report
Please find page 78 of the 2010 Experian annual report below. You can navigate through the pages in the report by either clicking on the pages listed below, or by using the keyword search tool below to find specific information within the annual report.
Experian Annual Report 2010 Governance76
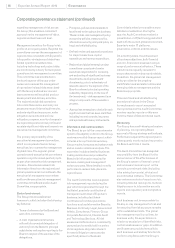
Performance graph
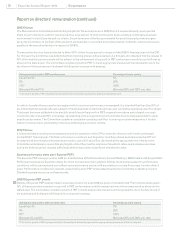
The Committee has chosen to illustrate the TSR for GUS plc until demerger and Experian plc for the period since listing on 11
October 2006 to 31 March 2010 against the FTSE 100 Index. The FTSE 100 Index is the most appropriate index against which TSR
should be measured as it is a widely used and understood index of leading UK companies.
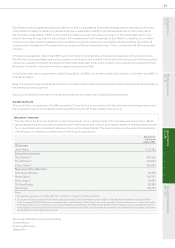
The above graphs show that, at 31 March 2010, a hypothetical £100 invested in GUS, and subsequently Experian, would have
generated a total return of £193 compared with a return of £134 if invested in the FTSE 100 Index on 31 March 2002, and a total
return of £142 compared with a return of £138 if invested on 31 March 2005.
With respect to Responsible Investment Disclosure, the Committee is satised that environmental, social and governance risks
are not raised by the incentive structure for senior management and do not inadvertently motivate irresponsible behaviour.
Meeting obligations under share-based incentives
Obligations under Experian’s employee share plans may be met using either shares purchased in the market or, except for rolled-
over awards under certain GUS schemes, newly issued shares. The current policy is that, where possible, all awards will be
satised by the purchase of shares, or from shares previously purchased, by the employee trusts. The policy will remain under
regular review. The rules of the Experian share plans are in line with the guidelines set out by the ABI regarding dilution.
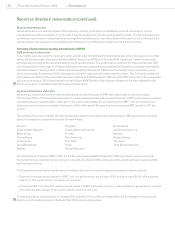
Shareholding guideline
The Committee believes that it is important that executives should build a signicant shareholding to align their interests with
those of shareholders. Therefore, the Committee has established guidelines under which the CEO should hold the equivalent of
two times his base salary in Experian plc shares and other executive directors one times their base salary, including shares held
under the CIP and the reinvestment plan. Each of the executive directors meets these guidelines.
Value of £100 invested in GUS/Experian
and the FTSE100 on 31 March 2005
£160
£140
£120
£100
£80
£60
£40
£20
£0
March 05 March 06 March 07 March 08 March 09 March 10
Value of £100 invested in GUS/Experian
and the FTSE100 on 31 March 2002
£250
£200
£150
£100
£50
£0
March 02 March 03 March 04 March 05 March 06 March 07 March 08 March 09 March 10
Performance as GUS (to 6 October 2006) Performance as Experian (from 6 October 2006) FTSE 100
Report on directors’ remuneration (continued)


