Experian 2010 Annual Report Download - page 116
Download and view the complete annual report
Please find page 116 of the 2010 Experian annual report below. You can navigate through the pages in the report by either clicking on the pages listed below, or by using the keyword search tool below to find specific information within the annual report.-
 1
1 -
2
-
3
-
4
-
5
-
6
-
7
-
8
-
9
-
10
-
11
-
12
-
13
-
14
-
15
-
16
-
17
-
18
-
19
-
20
-
21
-
22
-
23
-
24
-
25
-
26
-
27
-
28
-
29
-
30
-
31
-
32
-
33
-
34
-
35
-
36
-
37
-
38
-
39
-
40
-
41
-
42
-
43
-
44
-
45
-
46
-
47
-
48
-
49
-
50
-
51
-
52
-
53
-
54
-
55
-
56
-
57
-
58
-
59
-
60
-
61
-
62
-
63
-
64
-
65
-
66
-
67
-
68
-
69
-
70
-
71
-
72
-
73
-
74
-
75
-
76
-
77
-
78
-
79
-
80
-
81
-
82
-
83
-
84
-
85
-
86
-
87
-
88
-
89
-
90
-
91
-
92
-
93
-
94
-
95
-
96
-
97
-
98
-
99
-
100
-
101
-
102
-
103
-
104
-
105
-
 106
106 -
 107
107 -
 108
108 -
 109
109 -
 110
110 -
 111
111 -
 112
112 -
 113
113 -
 114
114 -
 115
115 -
 116
116 -
 117
117 -
 118
118 -
 119
119 -
 120
120 -
 121
121 -
 122
122 -
 123
123 -
 124
124 -
 125
125 -
 126
126 -
127
-
128
-
129
-
130
-
131
-
132
-
133
-
134
-
135
-
136
-
137
-
138
-
139
-
140
-
141
-
142
-
143
-
144
-
145
-
146
-
147
-
148
-
149
-
150
-
151
-
152
-
153
-
154
-
155
-
156
-
157
-
158
-
159
-
160
-
161
-
162
-
163
-
164
 |
 |

Experian Annual Report 2010 Financial statements114
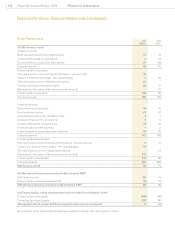
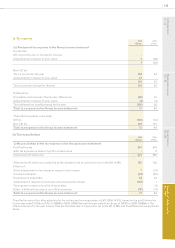
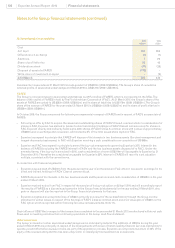
11. Net nance costs
2010
US$m
2009
US$m
(a) Net nance costs
Interest income:
Bank deposits and money market funds 17 16
Interest differential on derivatives 2 12
Expected return on pension plan assets 47 69
Interest income 66 97
Financing fair value gains:
Fair value gains on borrowings attributable to currency risk 16 -
Gains on interest rate swaps - fair value hedges 353
Fair value gains on non-hedging derivatives 53 -
Foreign exchange transaction gains 58 11
Movement in fair value of Serasa put option (note 5) - 21
Financing fair value gains 130 85
Finance income 196 182
Interest expense:
Bank loans and overdrafts 19 41
Eurobonds and notes 41 61
Commitment and facility utilisation fees 2 1
Unwind of discount on provisions 5 6
Interest differential on derivatives 31 30
Finance lease interest expense 1 2
Interest expense on pension plan liabilities 48 52
Interest expense 147 193
Financing fair value losses:
Fair value losses on borrowings attributable to interest rate risk 451
Losses on cross currency swaps - fair value hedges 22 -
Fair value losses on non-hedging derivatives -15
Movement in fair value of Serasa put option (note 5) 113 -
Financing fair value losses 139 66
Finance expense 286 259
Net nance costs 90 77
(b) Net interest expense included in Benchmark PBT
Net nance costs 90 77
Financing fair value remeasurements (9) 19
Net interest expense included in Benchmark PBT 81 96
(c) Financing fair value remeasurements included in net nance costs
Financing fair value gains (130) (85)
Financing fair value losses 139 66
Charge/(credit) in respect of nancing fair value remeasurements 9 (19)
An indication of the sensitivity of the Group’s results to interest rate risk is given in note 5.
Notes to the Group nancial statements (continued)