Experian 2010 Annual Report Download - page 20
Download and view the complete annual report
Please find page 20 of the 2010 Experian annual report below. You can navigate through the pages in the report by either clicking on the pages listed below, or by using the keyword search tool below to find specific information within the annual report.-
 1
1 -
2
-
3
-
4
-
5
-
6
-
7
-
8
-
9
-
 10
10 -
 11
11 -
 12
12 -
 13
13 -
 14
14 -
 15
15 -
 16
16 -
 17
17 -
 18
18 -
 19
19 -
 20
20 -
 21
21 -
 22
22 -
 23
23 -
 24
24 -
 25
25 -
 26
26 -
 27
27 -
 28
28 -
 29
29 -
 30
30 -
31
-
32
-
33
-
34
-
35
-
36
-
37
-
38
-
39
-
40
-
41
-
42
-
43
-
44
-
45
-
46
-
47
-
48
-
49
-
50
-
51
-
52
-
53
-
54
-
55
-
56
-
57
-
58
-
59
-
60
-
61
-
62
-
63
-
64
-
65
-
66
-
67
-
68
-
69
-
70
-
71
-
72
-
73
-
74
-
75
-
76
-
77
-
78
-
79
-
80
-
81
-
82
-
83
-
84
-
85
-
86
-
87
-
88
-
89
-
90
-
91
-
92
-
93
-
94
-
95
-
96
-
97
-
98
-
99
-
100
-
101
-
102
-
103
-
104
-
105
-
106
-
107
-
108
-
109
-
110
-
111
-
112
-
113
-
114
-
115
-
116
-
117
-
118
-
119
-
120
-
121
-
122
-
123
-
124
-
125
-
126
-
127
-
128
-
129
-
130
-
131
-
132
-
133
-
134
-
135
-
136
-
137
-
138
-
139
-
140
-
141
-
142
-
143
-
144
-
145
-
146
-
147
-
148
-
149
-
150
-
151
-
152
-
153
-
154
-
155
-
156
-
157
-
158
-
159
-
160
-
161
-
162
-
163
-
164
 |
 |
Experian Annual Report 2010 Business review18
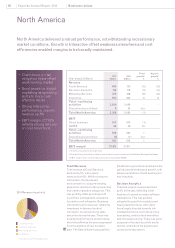
North America
North America delivered a robust performance, notwithstanding recessionary
market conditions. Growth in Interactive offset weakness elsewhere and cost
efciencies enabled margins to be broadly maintained.
(healthcare payments) annualised in the
period, and delivered good growth, with
deeper penetration of both existing and
new hospitals.
Decision Analytics
Total and organic revenue declined
by 3% in the year, reecting client
hesitancy to spend on major software
installations. This was partially
mitigated by growth in analytics and
fraud prevention tools, with client
focus largely directed towards risk
management tools, such as loan loss
forecasting, credit criteria evaluation
and risk-based pricing. There was good
progress in the start-up public sector
vertical, where both the pipeline and
conversions have grown.
Credit Services
Total revenue at Credit Services
declined by 5%, with organic
revenue down 6%. Within consumer
information, the depressed
environment for consumer lending
gave rise to declines in the prospecting
and credit origination categories. This
was partially offset by solid growth
in portfolio management, as lenders
focused on risk mitigation. Business
information performed well, reecting
investment in data and product
innovation, as well as strong sales
execution during the year. There was
a resilient performance at automotive,
which beneted as the year progressed
from the addition of new accident
data. The Search
America
acquisition
Client focus on risk •
mitigation helps offset
weak lending market
Good growth in digital •
marketing as spending
shifts to more cost-
effective media
Strong Interactive •
performance; organic
revenue up 8%
EBIT margin of 27.8% •
reects strong delivery
on cost reductions
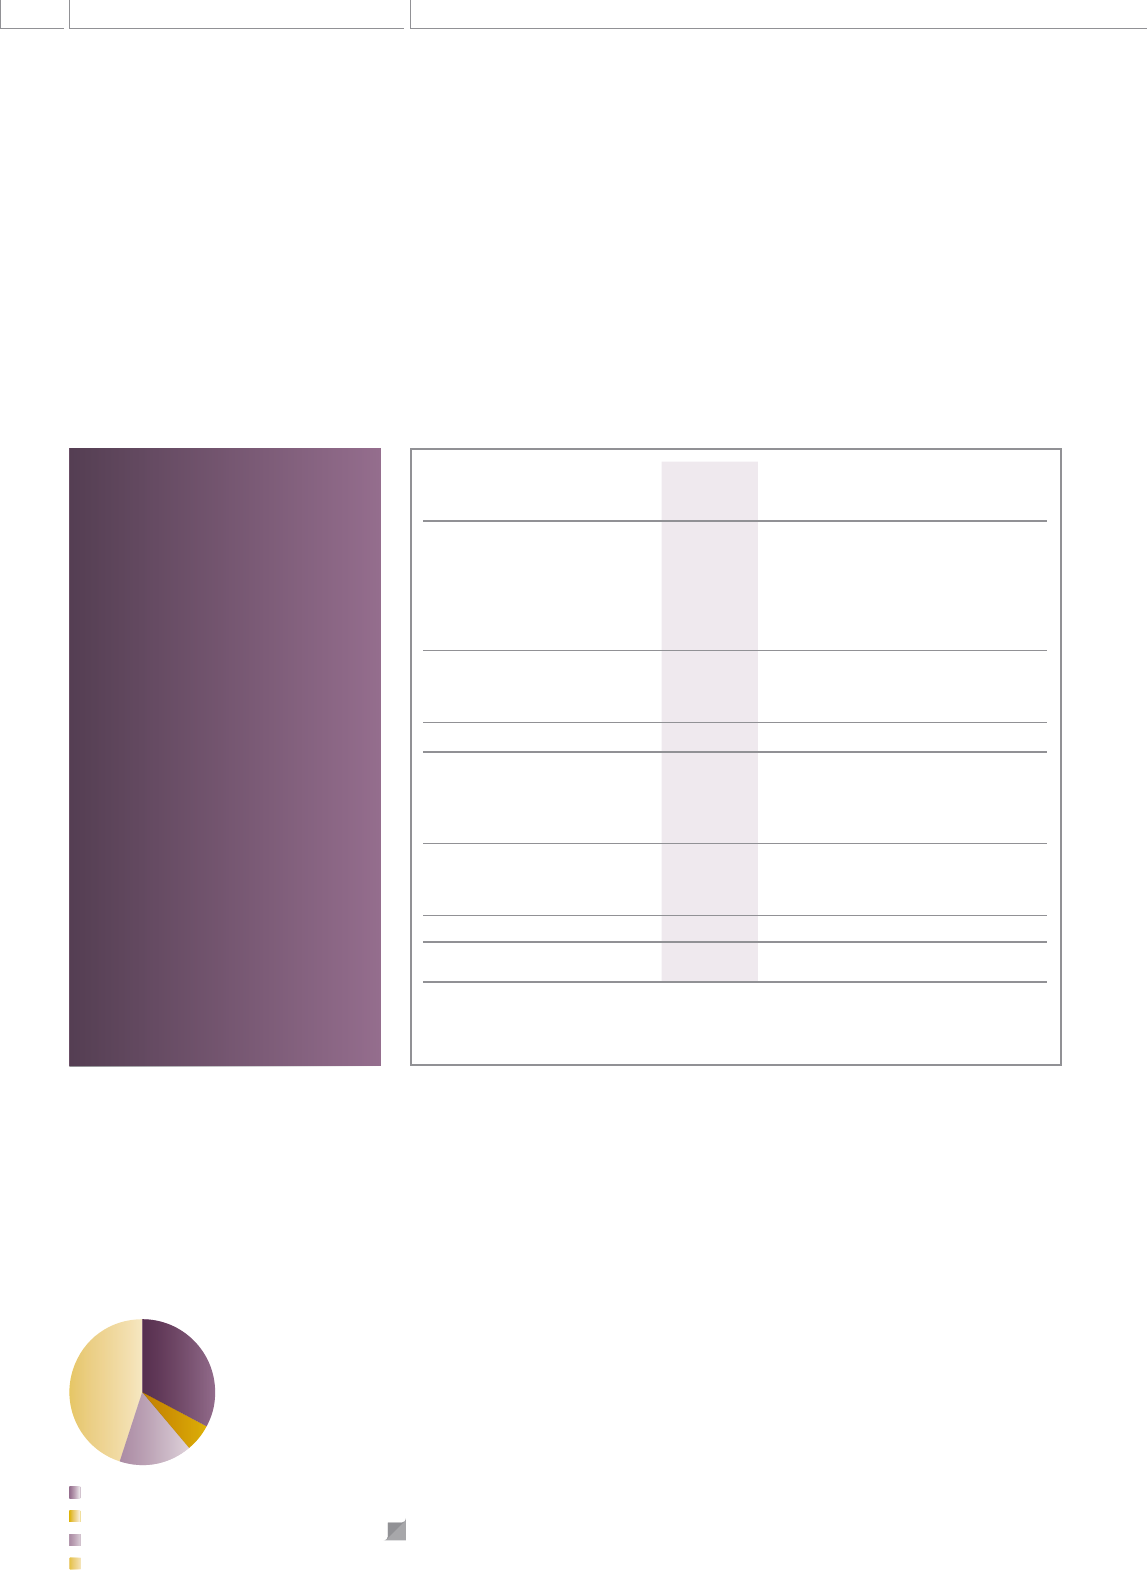
2010 Revenue by activity1
Decision Analytics
Credit Services
Marketing Services
Interactive
1 Excludes discontinuing activities
Year ended 31 March
2010
US$m
2009
US$m
Total
growth1
%
Organic
growth1
%
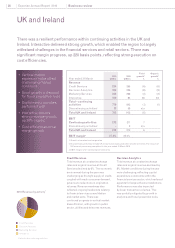
Revenue
Credit Services 693 730 (5) (6)
Decision Analytics 116 119 (3) (3)
Marketing Services 329 358 (8) (8)
Interactive 922 852 8 8
Total – continuing
activities 2,060 2,059 - -
Discontinuing activities2824 n/a
Total North America 2,068 2,083 (1)
EBIT
Direct business 572 575 (1)
FARES 56 48 16
Total – continuing
activities 628 623 1
Discontinuing activities2(5) (7) n/a
Total North America 623 616 1
EBIT margin327.8% 27.9%
1. Growth at constant exchange rates
2. Discontinuing activities include an online data survey business and the National Business Database
3. EBIT margin is for continuing business only, excluding FARES
47