Experian 2010 Annual Report Download - page 46
Download and view the complete annual report
Please find page 46 of the 2010 Experian annual report below. You can navigate through the pages in the report by either clicking on the pages listed below, or by using the keyword search tool below to find specific information within the annual report.-
 1
1 -
2
-
3
-
4
-
5
-
6
-
7
-
8
-
9
-
10
-
11
-
12
-
13
-
14
-
15
-
16
-
17
-
18
-
19
-
20
-
21
-
22
-
23
-
24
-
25
-
26
-
27
-
28
-
29
-
30
-
31
-
32
-
33
-
34
-
35
-
 36
36 -
 37
37 -
 38
38 -
 39
39 -
 40
40 -
 41
41 -
 42
42 -
 43
43 -
 44
44 -
 45
45 -
 46
46 -
 47
47 -
 48
48 -
 49
49 -
 50
50 -
 51
51 -
 52
52 -
 53
53 -
 54
54 -
 55
55 -
 56
56 -
57
-
58
-
59
-
60
-
61
-
62
-
63
-
64
-
65
-
66
-
67
-
68
-
69
-
70
-
71
-
72
-
73
-
74
-
75
-
76
-
77
-
78
-
79
-
80
-
81
-
82
-
83
-
84
-
85
-
86
-
87
-
88
-
89
-
90
-
91
-
92
-
93
-
94
-
95
-
96
-
97
-
98
-
99
-
100
-
101
-
102
-
103
-
104
-
105
-
106
-
107
-
108
-
109
-
110
-
111
-
112
-
113
-
114
-
115
-
116
-
117
-
118
-
119
-
120
-
121
-
122
-
123
-
124
-
125
-
126
-
127
-
128
-
129
-
130
-
131
-
132
-
133
-
134
-
135
-
136
-
137
-
138
-
139
-
140
-
141
-
142
-
143
-
144
-
145
-
146
-
147
-
148
-
149
-
150
-
151
-
152
-
153
-
154
-
155
-
156
-
157
-
158
-
159
-
160
-
161
-
162
-
163
-
164
 |
 |

Experian Annual Report 2010 Business review44
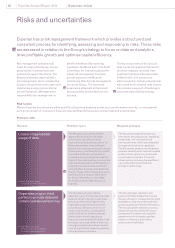
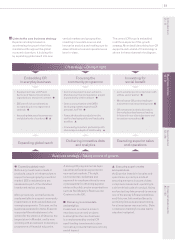
The Board formed a judgment at the
time of approving the Group and the
parent company nancial statements
that there was a reasonable expectation
that the Group and the Company
had adequate resources to continue
in operational existence for the
foreseeable future. In arriving at this
conclusion the Board took account
of current and anticipated trading
performance, together with the current
and anticipated levels of net debt
and the availability of the committed
borrowing facilities detailed above.
For this reason, the going concern
basis continues to be adopted in the
preparation of the Group and the parent
company nancial statements.
Use of non-GAAP nancial
information
Experian has identied certain
measures that it believes will assist
understanding of the performance
of the Group. As these measures are
not dened under IFRS, they may not
be directly comparable with other
companies’ adjusted measures. The
non-GAAP measures are not intended
to be a substitute for, or superior to,
any IFRS measures of performance
but management has included them as
these are considered to be important
comparables and key measures used
within the business for assessing
performance. Such non-GAAP
measures that are included within the
Group nancial statements are detailed
in note 4 to those nancial statements.
Further non-GAAP measures and
reconciliations of those measures are
set out below.
Earnings before interest, tax,
depreciation and amortisation
(‘EBITDA’)
EBITDA is dened as prot before
amortisation of acquisition intangibles,
goodwill impairments, charges in
respect of the demerger-related equity
incentive plans, exceptional items, net
nancing costs, tax, depreciation and
other amortisation. It includes
the Group’s share of associates’
pre-tax prot.
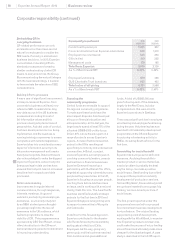
Income statement analysis – continuing operations
2010 2009
Benchmark
Non-
benchmark1Total Benchmark
Non-
benchmark1To t a l
Year ended 31 March US$m US$m US$m US$m US$m US$m
Revenue 3,880 -3,880 3,873 -3,873
Cost of sales (1,889) -(1,889) (1,824) -(1,824)
Gross prot 1,991 -1,991 2,049 -2,049
Distribution costs (419) -(419) (387) -(387)
Administrative expenses (639) (240) (879) (767) (282) (1,049)
Operating expenses (1,058) (240) (1,298) (1,154) (282) (1,436)
Operating prot/(loss) 933 (240) 693 895 (282) 613
Share of prots of associates 58 -58 44 (2) 42
EBIT from continuing operations 991 (240) 751 939 (284) 655
Net nance cost (81) (9) (90) (96) 19 (77)
Prot/(loss) before tax 910 (249) 661 843 (265) 578
Ta x (184) 167 (17) (184) 100 (84)
Prot/(loss) after tax for the year from
continuing operations 726 (82) 644 659 (165) 494
Attributable to:
Owners of Experian plc 681 (73) 608 631 (157) 474
Minority interests 45 (9) 36 28 (8) 20
Prot/(loss) after tax for the year from
continuing operations 726 (82) 644 659 (165) 494
US cents US cents US cents US cents US cents US cents
Earnings/(loss) per share – basic 67.1 (7.3) 59.8 62.3 (15.5) 46.8
%%%% % %
Effective rate of tax 20.2 67.1 2.6 21.8 37.7 14.5
1. These include charges for exceptional items of US$72m (2009: US$117m) and other non-GAAP measures of US$177m (2009: US$146m), full details of
which are included in note 10 to the Group nancial statements.
Financial review (continued)
100