Experian 2010 Annual Report Download - page 105
Download and view the complete annual report
Please find page 105 of the 2010 Experian annual report below. You can navigate through the pages in the report by either clicking on the pages listed below, or by using the keyword search tool below to find specific information within the annual report.-
 1
1 -
2
-
3
-
4
-
5
-
6
-
7
-
8
-
9
-
10
-
11
-
12
-
13
-
14
-
15
-
16
-
17
-
18
-
19
-
20
-
21
-
22
-
23
-
24
-
25
-
26
-
27
-
28
-
29
-
30
-
31
-
32
-
33
-
34
-
35
-
36
-
37
-
38
-
39
-
40
-
41
-
42
-
43
-
44
-
45
-
46
-
47
-
48
-
49
-
50
-
51
-
52
-
53
-
54
-
55
-
56
-
57
-
58
-
59
-
60
-
61
-
62
-
63
-
64
-
65
-
66
-
67
-
68
-
69
-
70
-
71
-
72
-
73
-
74
-
75
-
76
-
77
-
78
-
79
-
80
-
81
-
82
-
83
-
84
-
85
-
86
-
87
-
88
-
89
-
90
-
91
-
92
-
93
-
94
-
 95
95 -
 96
96 -
 97
97 -
 98
98 -
 99
99 -
 100
100 -
 101
101 -
 102
102 -
 103
103 -
 104
104 -
 105
105 -
 106
106 -
 107
107 -
 108
108 -
 109
109 -
 110
110 -
 111
111 -
 112
112 -
 113
113 -
 114
114 -
 115
115 -
116
-
117
-
118
-
119
-
120
-
121
-
122
-
123
-
124
-
125
-
126
-
127
-
128
-
129
-
130
-
131
-
132
-
133
-
134
-
135
-
136
-
137
-
138
-
139
-
140
-
141
-
142
-
143
-
144
-
145
-
146
-
147
-
148
-
149
-
150
-
151
-
152
-
153
-
154
-
155
-
156
-
157
-
158
-
159
-
160
-
161
-
162
-
163
-
164
 |
 |

103
Introduction
2 – 11
Business review
12 – 51
Governance
52 – 84
Financial statements
85 – 160
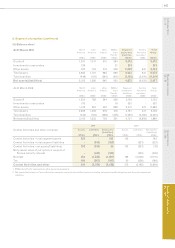
5. Financial risk management (continued)
This credit risk is minimised by a policy under which the Group only enters into such contracts with banks and nancial
institutions with strong credit ratings, within limits set for each organisation. Dealing activity is closely controlled and
counterparty positions are monitored regularly. The general credit risk on derivative nancial instruments utilised by the Group
is therefore not considered to be signicant. No credit limits were exceeded during the year and the Group does not anticipate
that any losses will arise from non-performance by these counterparties.
At the balance sheet date trade receivables with nancial institutions accounted for some 45% (2009: 37%) of total trade
receivables in the UK and some 20% (2009: 33%) of total trade receivables in the USA. The remaining balances are distributed
across multiple industries and geographies. The Group has implemented policies that require appropriate credit checks on
potential customers before granting credit. The maximum credit risk in respect of such nancial assets is the carrying value of
the assets.
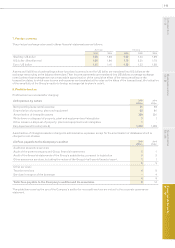
Liquidity risk
The Group maintains long-term committed facilities to ensure it has sufcient funds available for operations and planned
expansions. The Group monitors rolling forecasts of projected cash ows to ensure that it will have adequate undrawn
committed facilities available.
Details of the facilities available to the Group and their utilisation at the balance sheet date are given in note 24. The maturity
analysis of nancial liabilities is given in note 28.
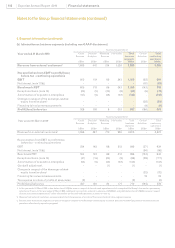
Capital risk management
The Group’s objectives in managing capital are to safeguard its ability to continue as a going concern in order to provide returns
for shareholders and benets for other stakeholders and to maintain an optimal capital structure and cost of capital.
In order to maintain or adjust the capital structure, the Group may adjust the amount of dividends paid to shareholders, return
capital to shareholders, issue new shares or sell assets to reduce net debt. As part of its internal reporting processes the Group
monitors capital employed by operating segment. For this purpose, capital employed excludes net debt and tax balances and at
31 March 2010 the Group’s capital employed was US$4,251m (2009: US$4,205m). The Group manages its working capital in order
to meet its target to convert at least 90% of EBIT into operating cash ow and the conversion percentage for the year ended 31
March 2010 was 98% (2009: 99%).
Fair value estimation
The fair value of derivative nancial instruments and other nancial assets and liabilities is determined by using market data
and established estimation techniques such as discounted cash ow and option valuation models. The fair value of foreign
exchange contracts is based on a comparison of the contractual and year end exchange rates. The fair values of other derivative
nancial instruments are estimated by discounting the future cash ows to net present values using appropriate market rates
prevailing at the year end.
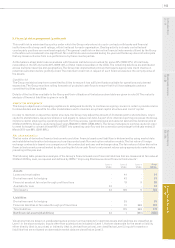
The following table presents an analysis of the Group’s nancial assets and nancial liabilities that are measured at fair value at
31 March 2010 by level, as required and dened by IFRS 7 ‘Improving Disclosures about Financial Instruments’:
Level 1
US$m
Level 2
US$m
Level 3
US$m
To t a l
US$m
Assets
Loans and receivables -44 -44
Derivatives used for hedging -43 -43
Financial assets at fair value through prot and loss -19 928
Available for sale 33 - - 33
Total assets 33 106 9148
Liabilities
Derivatives used for hedging -35 -35
Financial liabilities at fair value through prot and loss -70 669 739
Total liabilities -105 669 774
Net nancial assets/(liabilities) 33 1(660) (626)
Valuations that are based on unadjusted quoted prices in active markets for identical assets and liabilities are classied as
Level 1 in the above analysis. Inputs other than quoted prices included in Level 1, that are observable for the asset or liability,
either directly (that is, as prices) or indirectly (that is, derived from prices), are classied as Level 2. Inputs for assets or
liabilities that are not based on observable market data are classied as Level 3.