Experian 2010 Annual Report Download - page 143
Download and view the complete annual report
Please find page 143 of the 2010 Experian annual report below. You can navigate through the pages in the report by either clicking on the pages listed below, or by using the keyword search tool below to find specific information within the annual report.-
 1
1 -
2
-
3
-
4
-
5
-
6
-
7
-
8
-
9
-
10
-
11
-
12
-
13
-
14
-
15
-
16
-
17
-
18
-
19
-
20
-
21
-
22
-
23
-
24
-
25
-
26
-
27
-
28
-
29
-
30
-
31
-
32
-
33
-
34
-
35
-
36
-
37
-
38
-
39
-
40
-
41
-
42
-
43
-
44
-
45
-
46
-
47
-
48
-
49
-
50
-
51
-
52
-
53
-
54
-
55
-
56
-
57
-
58
-
59
-
60
-
61
-
62
-
63
-
64
-
65
-
66
-
67
-
68
-
69
-
70
-
71
-
72
-
73
-
74
-
75
-
76
-
77
-
78
-
79
-
80
-
81
-
82
-
83
-
84
-
85
-
86
-
87
-
88
-
89
-
90
-
91
-
92
-
93
-
94
-
95
-
96
-
97
-
98
-
99
-
100
-
101
-
102
-
103
-
104
-
105
-
106
-
107
-
108
-
109
-
110
-
111
-
112
-
113
-
114
-
115
-
116
-
117
-
118
-
119
-
120
-
121
-
122
-
123
-
124
-
125
-
126
-
127
-
128
-
129
-
130
-
131
-
132
-
 133
133 -
 134
134 -
 135
135 -
 136
136 -
 137
137 -
 138
138 -
 139
139 -
 140
140 -
 141
141 -
 142
142 -
 143
143 -
 144
144 -
 145
145 -
 146
146 -
 147
147 -
 148
148 -
 149
149 -
 150
150 -
 151
151 -
 152
152 -
 153
153 -
154
-
155
-
156
-
157
-
158
-
159
-
160
-
161
-
162
-
163
-
164
 |
 |

141
Introduction
2 – 11
Business review
12 – 51
Governance
52 – 84
Financial statements
85 – 160
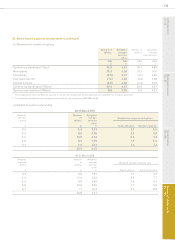
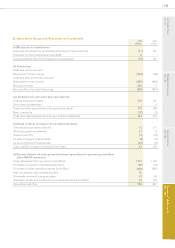
31. Deferred tax (continued)
(c) Deferred tax liabilities
Movements in gross deferred tax liabilities, without taking into consideration the offsetting of liabilities and assets within the
same tax jurisdiction, comprise:
Property
valuations
US$m
Accelerated
depreciation
US$m
Intangibles
US$m
Share option
and award
plans
US$m
Tax losses
US$m
Other
temporary
differences
US$m
To t a l
US$m
At 1 April 2009 - 5 243 - - 142 390
Differences on exchange - 1 32 - - - 33
Income statement charge/(credit) -30 86 - - (106) 10
Business combinations - - 5 - - - 5
Transfer in respect of liabilities held
for sale - - (4) - - - (4)
At 31 March 2010 -36 362 - - 36 434
Property
valuations
US$m
Accelerated
depreciation
US$m
Intangibles
US$m
Share option
and award
plans
US$m
Tax losses
US$m
Other
temporary
differences
US$m
Tot a l
US$m
At 1 April 2008 5 37 184 1 4 176 407
Differences on exchange 8 (2) (48) - - (37) (79)
Income statement charge/(credit) (13) 6 (57) (1) (4) 82 13
Business combinations - - 20 - - - 20
Trans f e r s - (36) 144 - - (79) 29
At 31 March 2009 - 5 243 - - 142 390
Deferred tax liabilities of US$1,447m (2009: US$2,062m) have not been recognised for the withholding tax and other taxes that
would be payable on the unremitted earnings of certain subsidiaries. As the earnings are continually reinvested by the Group, no
tax is expected to be payable on them in the foreseeable future. The decrease in the unrecognised liabilities in the year resulted
from changes in the Group structure.
At the balance sheet date there were deferred tax liabilities expected to reverse within the next year of US$57m (2009: US$94m).