Experian 2010 Annual Report Download - page 106
Download and view the complete annual report
Please find page 106 of the 2010 Experian annual report below. You can navigate through the pages in the report by either clicking on the pages listed below, or by using the keyword search tool below to find specific information within the annual report.-
 1
1 -
2
-
3
-
4
-
5
-
6
-
7
-
8
-
9
-
10
-
11
-
12
-
13
-
14
-
15
-
16
-
17
-
18
-
19
-
20
-
21
-
22
-
23
-
24
-
25
-
26
-
27
-
28
-
29
-
30
-
31
-
32
-
33
-
34
-
35
-
36
-
37
-
38
-
39
-
40
-
41
-
42
-
43
-
44
-
45
-
46
-
47
-
48
-
49
-
50
-
51
-
52
-
53
-
54
-
55
-
56
-
57
-
58
-
59
-
60
-
61
-
62
-
63
-
64
-
65
-
66
-
67
-
68
-
69
-
70
-
71
-
72
-
73
-
74
-
75
-
76
-
77
-
78
-
79
-
80
-
81
-
82
-
83
-
84
-
85
-
86
-
87
-
88
-
89
-
90
-
91
-
92
-
93
-
94
-
95
-
 96
96 -
 97
97 -
 98
98 -
 99
99 -
 100
100 -
 101
101 -
 102
102 -
 103
103 -
 104
104 -
 105
105 -
 106
106 -
 107
107 -
 108
108 -
 109
109 -
 110
110 -
 111
111 -
 112
112 -
 113
113 -
 114
114 -
 115
115 -
 116
116 -
117
-
118
-
119
-
120
-
121
-
122
-
123
-
124
-
125
-
126
-
127
-
128
-
129
-
130
-
131
-
132
-
133
-
134
-
135
-
136
-
137
-
138
-
139
-
140
-
141
-
142
-
143
-
144
-
145
-
146
-
147
-
148
-
149
-
150
-
151
-
152
-
153
-
154
-
155
-
156
-
157
-
158
-
159
-
160
-
161
-
162
-
163
-
164
 |
 |

Experian Annual Report 2010 Financial statements104
Notes to the Group nancial statements (continued)
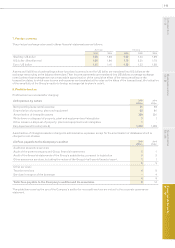
5. Financial risk management (continued)
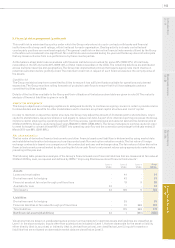
The following table presents an analysis of the changes in Level 3 nancial assets and liabilities for the year ended 31 March 2010
which comprise put and call options associated with corporate transactions:
Financial assets/(liabilities) classied as Level 3 Serasa put
option
US$m
Other
derivatives
US$m
To t a l
US$m
At 1 April 2009 (424) -(424)
Additions in the year -(8) (8)
Valuation gains and losses recognised in income statement (note 11) (113) 9(104)
Currency translation gains and losses recognised in other comprehensive income (124) -(124)
At 31 March 2010 (661) 1(660)
The put option associated with the remaining 30% stake in Serasa is valued at the higher of 95% of the equity value of Serasa
or the value of Serasa based on the P/E ratio of Experian and the latest earnings of Serasa. A Monte Carlo simulation has been
used to calculate the liability. The key assumptions in arriving at the value of the put are the equity value of Serasa, the future
P/E ratio of Experian at the date of exercise, the respective volatilities of Experian and Serasa and the risk free rate in Brazil. It
is also assumed that the put may be exercised in June 2012. Gains and losses in respect of the valuation of the put option since
acquisition in June 2007 have been recorded as nancing fair value remeasurements. Movements in the year ended 31 March 2010
primarily relate to an increase in the equity value of Serasa.
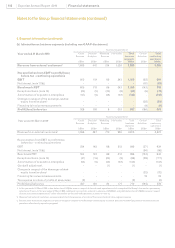
6. Segmental information
Under IFRS 8 'Operating Segments', an operating segment is a component of an entity:
that engages in business activities from which it may earn revenues and incur expenses (including revenues and expenses -
relating to transactions with other components); and
whose operating results are regularly reviewed by the chief operating decision maker to assess its performance and make -
decisions about resources to be allocated to the segment; and
for which discrete nancial information is available. -
Experian is organised into, and managed on a worldwide basis over, the following ve operating segments, based on geographic
areas, supported by its central Group functions:
North America; -
Latin America; -
UK and Ireland; -
Europe, Middle East and Africa (‘EMEA’); and -
Asia Pacic. -
The chief operating decision maker, identied in accordance with the requirements of IFRS 8, assesses the performance of the
above operating segments on the basis of EBIT, as dened in note 4.